Ether Rallies 13% then Loses All Gains
Ether prices rallied over 13 percent versus bitcoin but then lost all the gains. Dash on the other hand is down over 5% vs BTC today.
Ether Rallies 13% then Loses All Gains
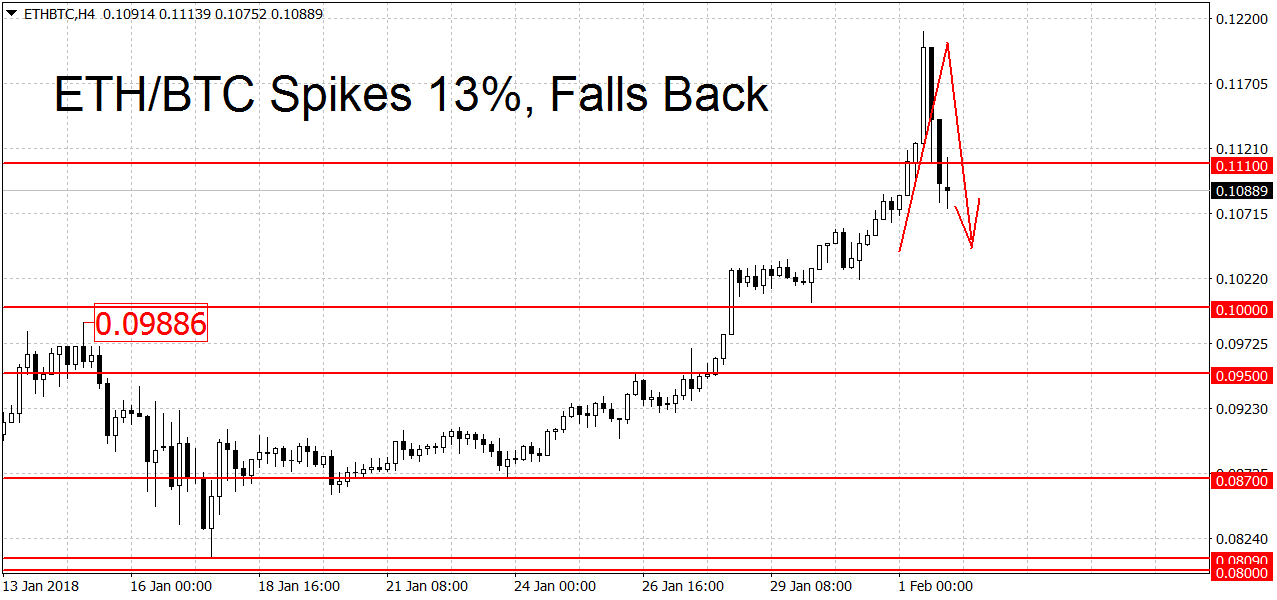
Ether prices rallied over 13% versus bitcoin yesterday and hit 0.121 BTC per coin. The highs were quickly sold into however as the general crypto market saw declines. Bitcoin is currently down almost 15% versus the U.S. Dollar and that usually triggers altcoin losses as well.
The ETH/BTC pair is quoted at 0.10889 right now, around the same price it had at the start of the day. As you can see on the chart above, the V-shaped formation shows that all gains during the past 24 hours have been lost.
Nonetheless the pair remains in an uptrend. To end it the bears will need to push us below the 0.087 BTC swing low. A break below 0.08 BTC may start a new downtrend. Above these levels we find support at 0.1 BTC, 0.09886 and 0.095 BTC. Higher up there’s resistance at yesterday’s high of 0.121 BTC followed by the 0.15 round figure and the 0.15098 all-time high. On the longer-term weekly and monthly charts ETH/BTC is still looking bullish.
Dash Down on the Day
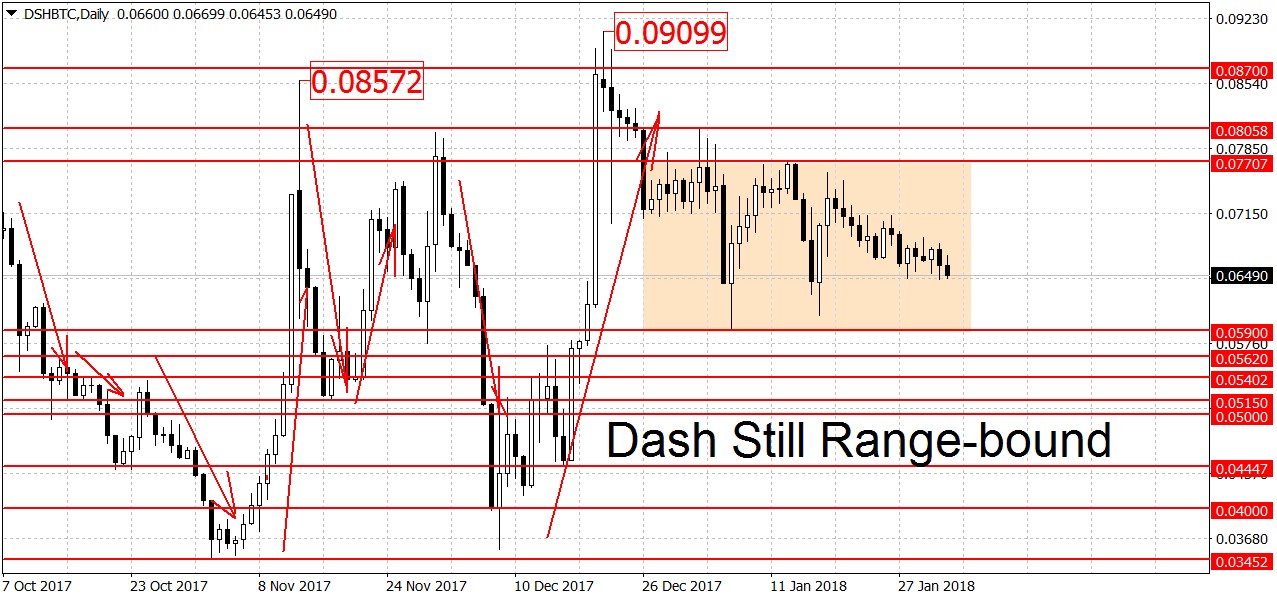
While Ether ended the day mostly unchanged vs BTC (after a volatile session), Dash closed the session lower. One Dash is selling for 0.0649 right now, down from 0.06769 BTC this morning.
As can be seen on the chart above, DSH/BTC remains in a range on the daily charts. The bulls and the bears have been stuck in battle for the past month here. For now we remain in ‘wait and see’ mode here. The rectangle above shows the potential breakout points for this pair. A clean break below 0.059 BTC would start a new downtrend. Support below here can be found around the 0.05 round figure. A clearing of this support area could lead to more losses.
A break above 0.077 BTC may potentially start a new uptrend in prices. Close to here we have another resistance at 0.08058 BTC. Higher still we find more resistance levels at 0.08572, 0.087 and 0.09099 BTC. The 0.1 round figure is another potential resistance point. Dash is also range-bound on the weekly chart. Prices are looking bullish on the monthly charts however.