


Ether Resting on Key Support
FXOpen

Ether prices are resting on a key support level, a break of which could lead to a new downtrend. Dash, on the other hand, is already in a downtrend after a string of nine bearish daily candles.
Ether Resting on Key Support
Ether is resting near key support around 0.06626 BTC. A few days ago we again tested this level with prices bottoming out at 0.06643 BTC before climbing higher. But the bounce was short-lived and we are currently quoted at 0.06763 BTC, very close to the lows.
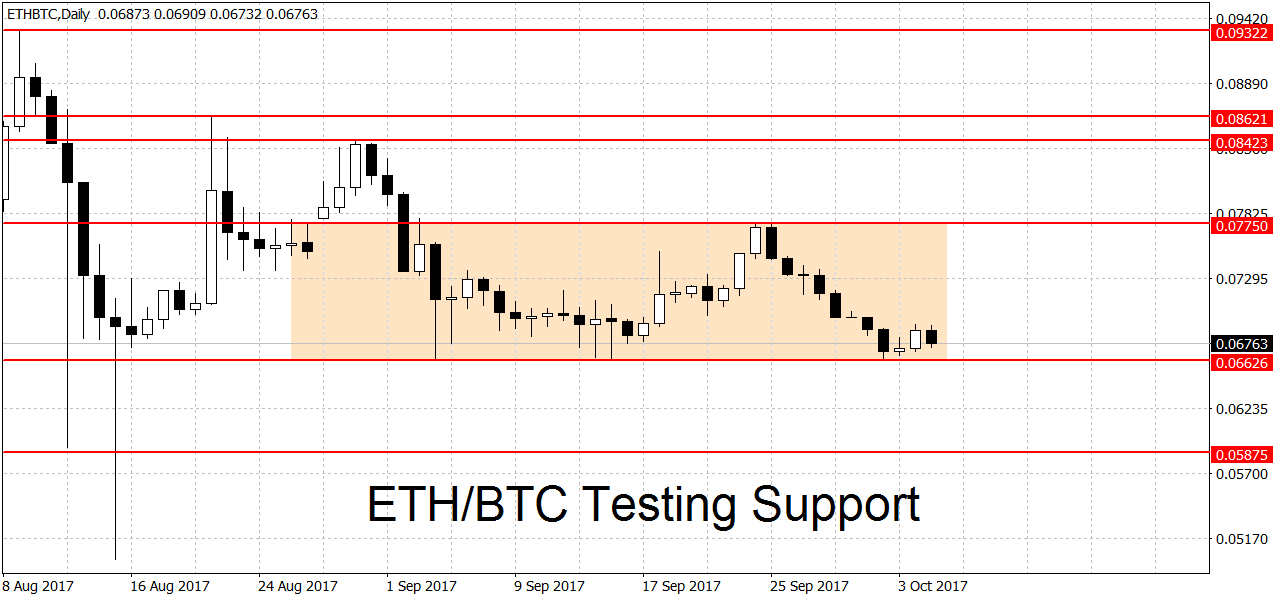
The support near 0.06626 BTC has been tested multiple times and remains a key level going forward. A break of this important support could start a new downtrend in ETH/BTC. On the other end, we have the swing high at 0.07750 BTC. A breakout above here could lead to a new rally. As usual with these levels, we’re looking for a sustained break, not just a brief and shallow spike lower/higher.
With prices just skirting on support, things are looking grim for the bulls right now. But all hope is not lost. The Byzantium protocol upgrade has been hard-coded and is now set at block 4,370,000. Current projections put this on October 17th. If everything goes well, the upgrade should improve the speed and security of the network, as well as have a positive impact on the price of Ether. On the weekly charts, ETH/BTC is range-bound as well. The monthlies are still showing a bullish bias.
Dash in Downtrend
After nine consecutive bearish daily candles, DSH/BTC is now in a downtrend. We’re trading just above the 0.07 round figure right now, after an earlier foray below it got stopped by the bulls.
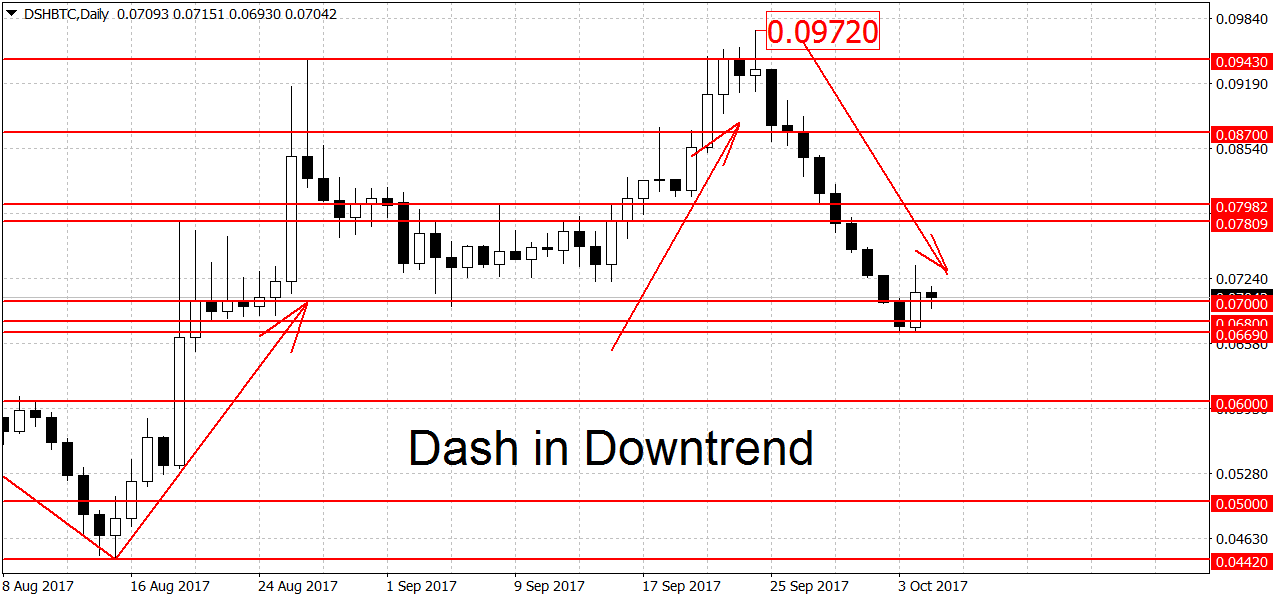
We have a strong support area below current prices consisting of several levels at 0.07 BTC, 0.068 BTC and finally 0.06690 BTC. A clearing of this area should lead to exacerbated losses for Dash. Further down we find more support at the 0.06 and 0.05 BTC round figures, followed by the 0.04420 swing low.
On the other end, the key level is 0.091 BTC. A breakout above here would end the fledgling downtrend. Higher up we need to see a break of the five-month high at 0.09720 BTC to re-start the rally. While down on the daily, on both the weekly and the monthly charts DSH/BTC is still in rally mode.
Trade crypto currency with FXOpen broker.
FXOpen offers the world's most popular cryptocurrency CFDs*, including Bitcoin and Ethereum. Floating spreads, 1:2 leverage — at your service (additional fees may apply). Open your trading account now or learn more about crypto CFD trading with FXOpen.
*Important: At FXOpen UK, Cryptocurrency trading via CFDs is only available to our Professional clients. They are not available for trading by Retail clients. To find out more information about how this may affect you, please get in touch with our team.
This article represents the opinion of the Companies operating under the FXOpen brand only. It is not to be construed as an offer, solicitation, or recommendation with respect to products and services provided by the Companies operating under the FXOpen brand, nor is it to be considered financial advice.
Stay ahead of the market!
Subscribe now to our mailing list and receive the latest market news and insights delivered directly to your inbox.


Latest articles

Apple: Earnings Day Above the Activity Zone
On 30 April, after the market close, Apple Inc. will release its financial results for the second quarter of fiscal 2026. The consensus forecast, based on estimates from 31 analysts, points to revenue of around $109.7 billion, with expected

USD/JPY and USD/CHF Near Key Levels: The Dollar Supported by the Fed
The US dollar continues to trend upwards following the Federal Reserve meeting, drawing support from the regulator’s moderately hawkish stance and comments by Jerome Powell. Markets interpret the Fed’s rhetoric as a signal that restrictive policy is likely

EUR/USD and GBP/USD consolidate ahead of the Fed decision
European currencies are showing subdued dynamics, entering a consolidation phase following their previous advance. Earlier, EUR/USD and GBP/USD broke out of their ranges and strengthened; however, the subsequent correction has led both pairs to retest the previously breached