


Ether Up, Dash Down vs. Bitcoin
FXOpen
Mixed results for the two cryptos we’ll cover today. While Ether gained ground on BTC compared to last week, Dash lost some. But both the gains for ETH and the loss for DSH haven’t been drastic.
ETH/BTC Slowly Trending Higher
The price of ETH/BTC has been slowly trending higher the past few days. Our last update recorded a print of 0.08814 BTC and we’re currently quoted at 0.09294 BTC, a gain of 5.6 percent.
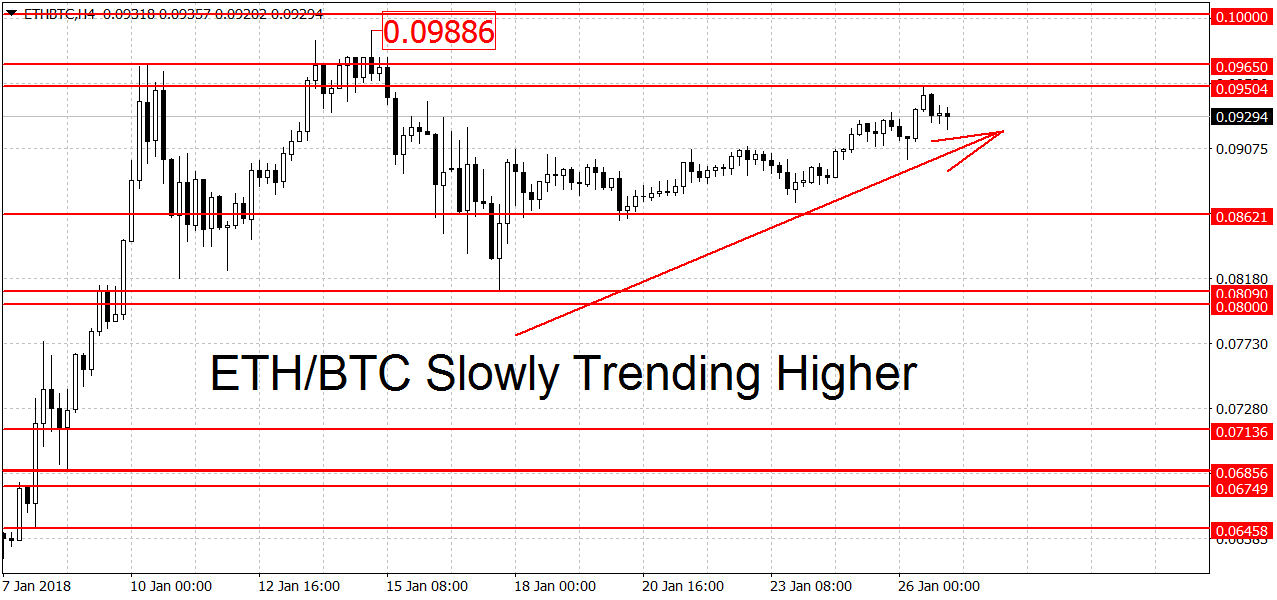
As you can see on the chat above the pair has been going up strongly since early December and more gradually since the 0.08090 BTC bottom. A break below here would end the current uptrend. A move below 0.06458 BTC is needed to start a new downtrend. Other support levels in-between can be found at 0.06749, 0.06856 and 0.07136 BTC. Higher still the 0.08 round figure may act as temporary support as well.
On the upper end we have resistance at yesterday’s highs of 0.09504 BTC, followed by the 0.09650 swing high and the January highs at 0.09886 BTC. The 0.01 round figure is another notable resistance point, as is the all-time high at 0.015098 BTC. On the longer-term weekly and monthly charts ETH/BTC is keeping the bullish bias.
Dash Down vs Bitcoin
Dash prices are trading lower versus bitcoin. One Dash is selling for 0.06861 BTC right now, down from 0.07238 BTC last week. This is a relatively small drop of 4.8 percent for DSH/BTC. Back in December we saw this pair move by over 30 percent on some days.
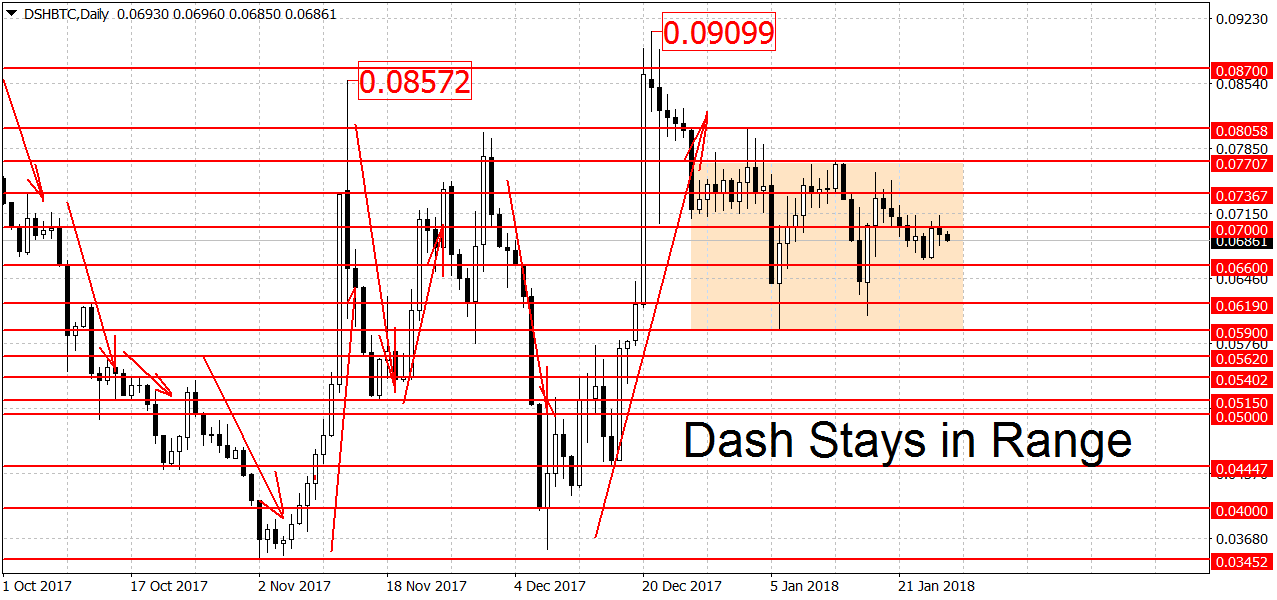
Despite the drop, Dash stayed inside its range, as can be seen on the chart above. The number ‘to beat’ is still 0.059 BTC on the downside. A break below here could start a new downtrend. Last week we got close to it but prices bottomed out at 0.06059 BTC. Support below here can be found around the 0.05 round figure. A clearing of this support area should lead to more losses.
Higher up the bulls need a breakout above the 0.07707 swing high. Close to here we have another potential resistance at 0.08058 BTC. Conservative traders may wait to see if this level breaks too. Higher still there’s resistance at 0.08572, 0.087 and 0.09099 BTC. The 0.1 round figure is another potential resistance point for DSH/BTC. On the longer-term charts Dash is range-bound on the weekly but bullish on the monthly.
FXOpen offers the world's most popular cryptocurrency CFDs*, including Bitcoin and Ethereum. Floating spreads, 1:2 leverage — at your service (additional fees may apply). Open your trading account now or learn more about crypto CFD trading with FXOpen.
*Important: At FXOpen UK, Cryptocurrency trading via CFDs is only available to our Professional clients. They are not available for trading by Retail clients. To find out more information about how this may affect you, please get in touch with our team.
This article represents the opinion of the Companies operating under the FXOpen brand only. It is not to be construed as an offer, solicitation, or recommendation with respect to products and services provided by the Companies operating under the FXOpen brand, nor is it to be considered financial advice.
Stay ahead of the market!
Subscribe now to our mailing list and receive the latest market news and insights delivered directly to your inbox.


Latest articles

EUR/USD Eyes Gains As USD/CHF Weakness Deepens Again
EUR/USD started a fresh increase above 1.1700 and 1.1720. USD/CHF declined further and is now struggling below 0.7835.
Important Takeaways for EUR/USD and USD/CHF Analysis Today
· The Euro started a decent increase from

Apple: Earnings Day Above the Activity Zone
On 30 April, after the market close, Apple Inc. will release its financial results for the second quarter of fiscal 2026. The consensus forecast, based on estimates from 31 analysts, points to revenue of around $109.7 billion, with expected

USD/JPY and USD/CHF Near Key Levels: The Dollar Supported by the Fed
The US dollar continues to trend upwards following the Federal Reserve meeting, drawing support from the regulator’s moderately hawkish stance and comments by Jerome Powell. Markets interpret the Fed’s rhetoric as a signal that restrictive policy is likely