


ETHUSD and LTCUSD Technical Analysis – 05th JAN, 2023
FXOpen

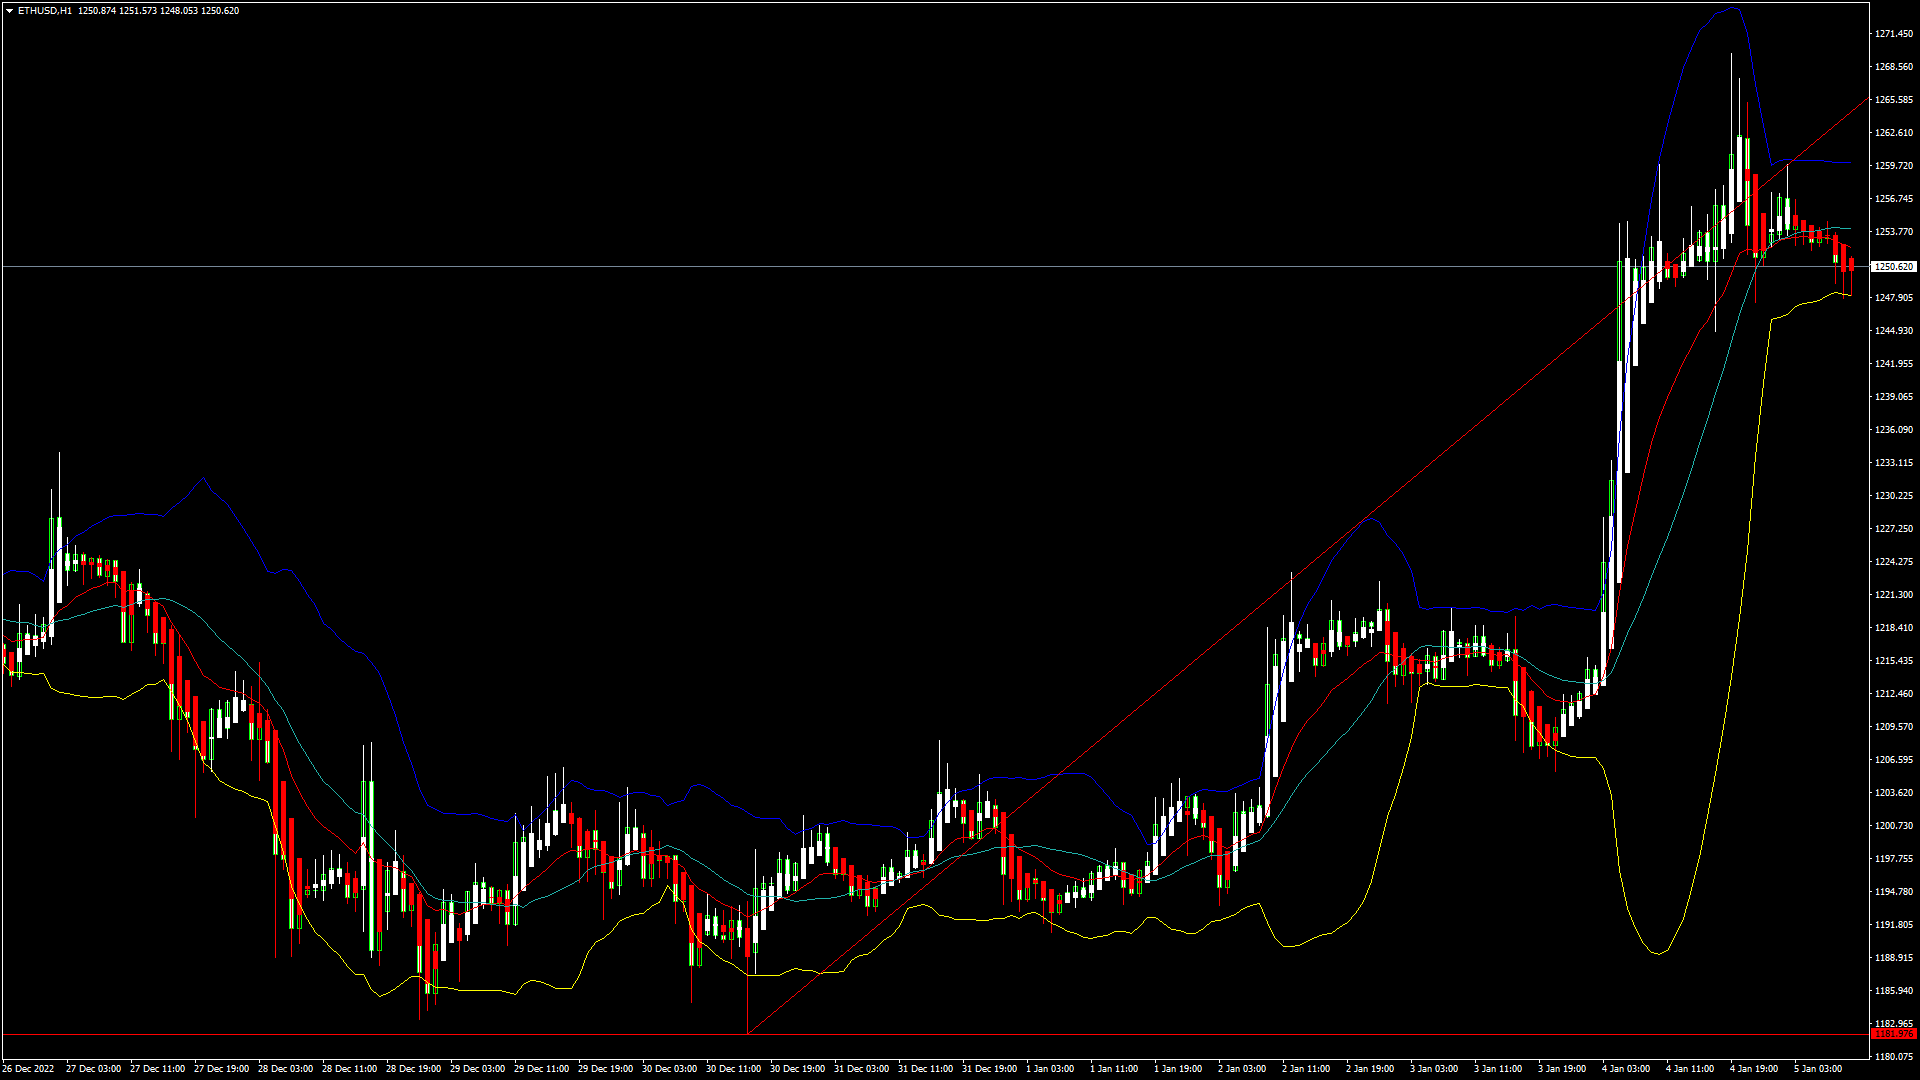
ETHUSD: Bullish Engulfing Pattern Above $1181
Ethereum was unable to sustain its bearish momentum and after touching a low of 1181 on 30th Dec, the price started to correct upwards against the US dollar moving into a consolidation channel above the $1200 handle today in the European trading session.
We can see the formation of bullish engulfing lines in the weekly time frame.
We can clearly see a bullish engulfing pattern above the $1181 handle which is a bullish pattern and signifies the end of a bearish phase and the start of a bullish phase in the markets.
ETH is now trading just below its pivot level of 1251 and moving into a consolidation channel. The price of ETHUSD is now testing its classic resistance level of 1254 and Fibonacci resistance level of 1257 after which the path towards 1300 will get cleared.
The relative strength index is at 69.10 indicating a STRONG demand for Ether and the continuation of the buying pressure in the markets.
The average directional index is indicating a NEUTRAL level, which means that the price is expected to remain under consolidation in the short-term range.
Most of the technical indicators are giving a BUY market signal.
Most of the moving averages are giving a BUY signal at the current market levels of $1250.
ETH is now trading Above its 100 hourly simple and 200 hourly exponential moving averages.
- Ether: bullish reversal seen above the $1181 mark
- The short-term range appears to be mildly bullish
- ETH continues to remain above the $1250 levels
- The average true range is indicating HIGH market volatility
Ether: Bullish Reversal Seen Above $1181
ETHUSD continues to move higher against the US dollar today and we are looking at $1300 as the immediate target.
We can see a bullish trend reversal pattern with the adaptive moving averages AMA20 and AMA50 in the daily time frame.
We have seen a bullish opening in the markets this week.
We have also detected the formation of a bullish harami cross pattern in the 2-hour time frame.
ETHUSD touched an intraday high of 1259 in the Asian trading session and an intraday low of 1248 in the European trading session today.
The daily RSI is printing at 55 indicating a NEUTRAL demand for Ether in the long-term range.
The key support levels to watch are $1228 at which the price crosses 18-day moving average, and $1233 which is a 14-3 day raw stochastic at 50%.
ETH has decreased by 0.04% with a price change of 0.5494$ in the past 24hrs and has a trading volume of 4.869 billion USD.
We can see a decrease of 7.00% in the total trading volume in the last 24 hrs which appears to be normal.
The Week Ahead
ETH’s price has started to break above the $1250 and is now looking at $1300 level. The potential upsides are $1300 to $1400 in the medium-term.
The prices of Ethereum are ranging near the support of the channel in the 15-minute time frame indicating bullish trends.
The immediate short-term outlook for Ether has turned mildly bullish, the medium-term outlook has turned neutral, and the long-term outlook for Ether is neutral under present market conditions.
The resistance zone is located at $1259 at which the price crosses 18-day moving average stalls, and at $1281 which is a 14-3 day raw stochastic at 80%.
The weekly outlook is projected at $1350 with a consolidation zone of $1300.
Technical Indicators:
The STOCHRSI: is at 63.54 indicating a BUY
The Williams percent range: is at -28.52 indicating a BUY
The rate of price change: is at 2.869 indicating a BUYThe bull/bear power (13): is at 26.01 indicating a BUY
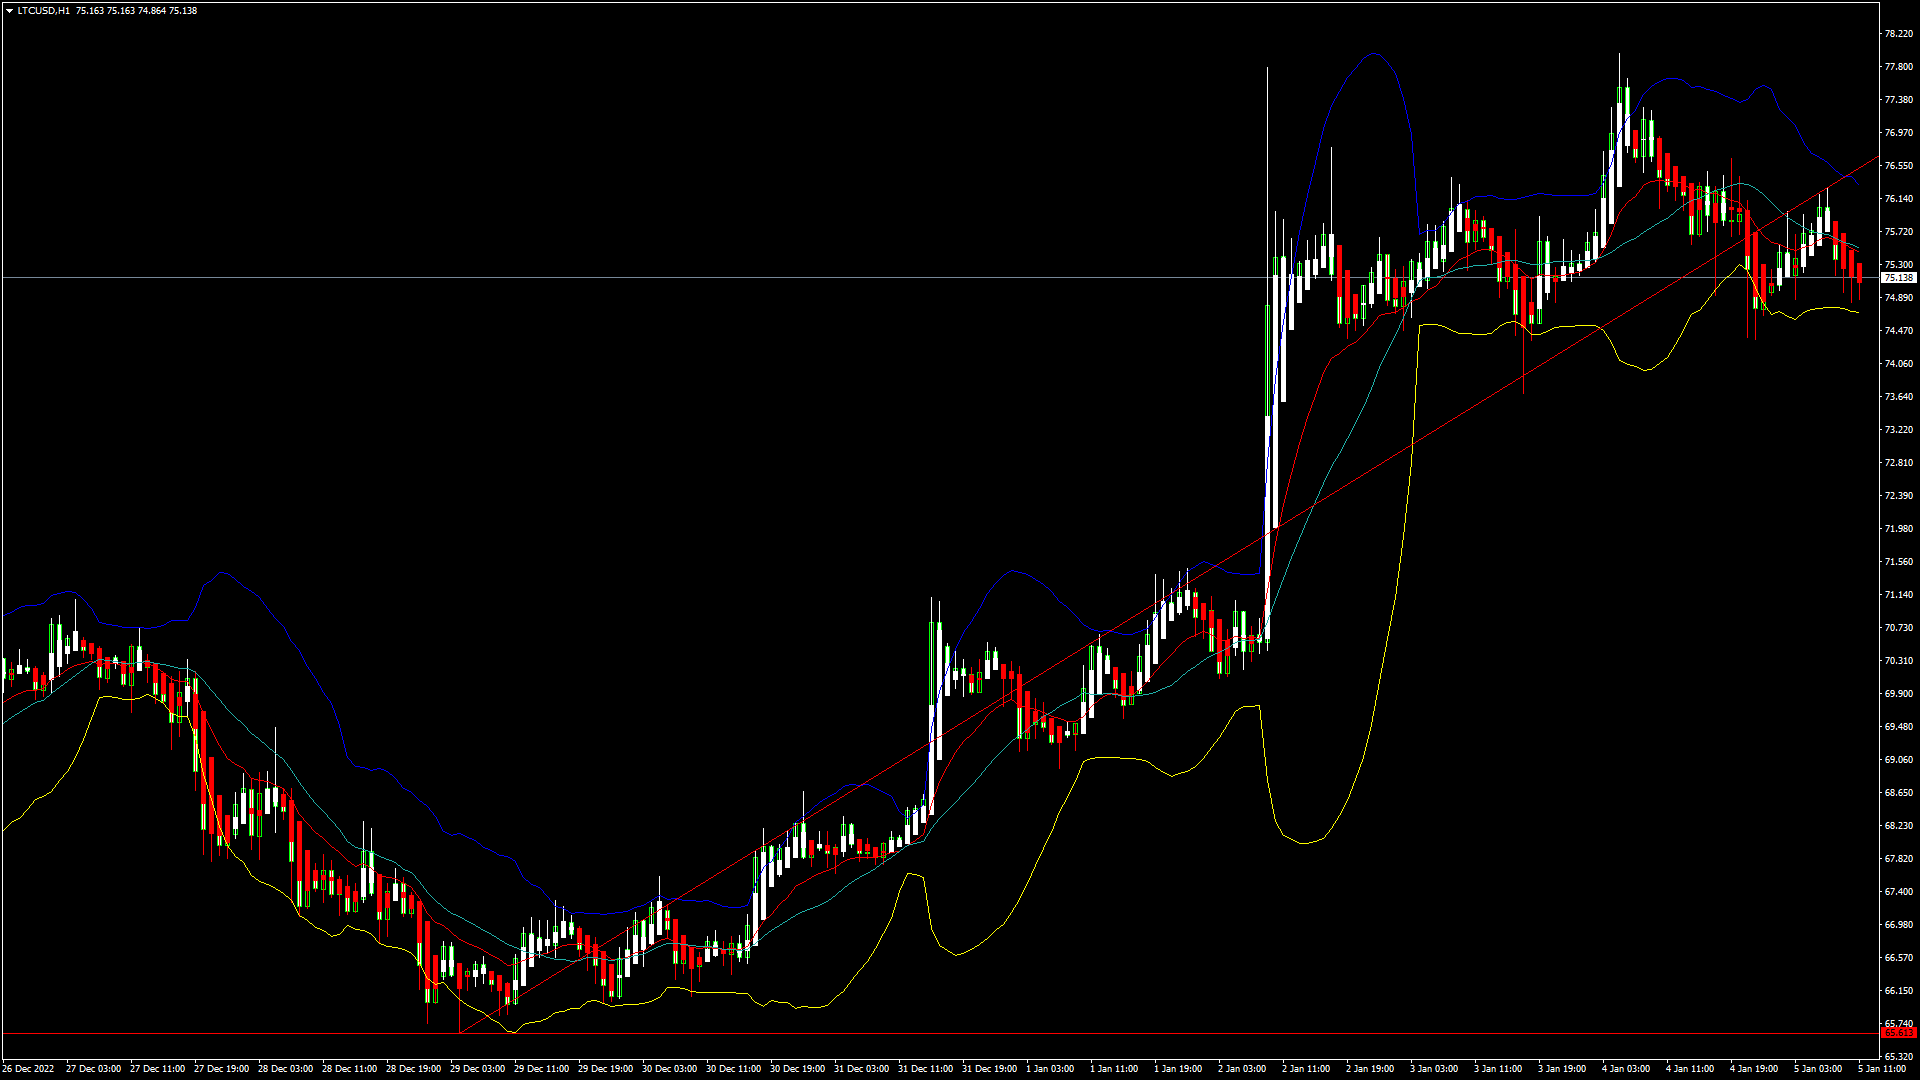
LTCUSD: Bullish Harami Cross Pattern Above $65.61
Litecoin was unable to sustain its bearish momentum last week and after touching a low of $65.61 on 29th Dec, the price started to move upwards against the US dollar crossing the $75.00 handle on 04th Jan.
We have seen a bullish opening of the markets this week.
We can clearly see a bullish harami cross pattern above the $65.61 handle which is a bullish pattern and signifies the end of a bearish phase and the start of a bullish phase in the markets.
Litecoin is now trading above its 100 hourly simple moving average and below its 200 hourly simple moving average. The price of LTCUSD is just below its pivot level of 75.91.
The relative strength index is at 60.92 indicating a STRONG demand for Litecoin and the continuation of the buying pressure in the markets.
The price of Litecoin continues to remain above most of the moving averages, which are now giving a BUY signal at current market levels of 75.05.
The prices of Litecoin are nearing a NEW record high this week.
The aroon Indicator is giving a bullish trend in the 1-hour time frame.
The short-term outlook for Litecoin has turned strongly bullish.
- Most of the technical indicators are giving a buy signal
- Litecoin: bullish reversal seen above the $65.61 level
- STOCHRSI is giving an OVERBOUGHT signal
- The average true range is indicating LESS market volatility
Litecoin: Bullish Reversal Seen Above $65.61
The price of Litecoin is staging a recovery against the US dollar and the immediate visible targets are $80 and $85 levels.
We can see the formation of the moving average bullish crossover pattern with the adaptive moving averages AMA20 and AMA50 in the daily time frame.
The price of LTCUSD is now facing its classic resistance level of 75.33 and Fibonacci resistance level of 79.25 after which the path towards $80 will get cleared.
Litecoin touched an intraday high of $76.26 in the Asian trading session and an intraday low of $74.82 in the European trading session today.
Litecoin is now facing its resistance zone at $76.20 at which the price crosses 18-day moving average stalls and at $78.76 which is a 3-10 day MACD oscillator stalls.
LTCUSD has decreased by 1.89% with a price change of 1.44$ in the past 24hrs and has a trading volume of 0.443 billion USD.
Litecoin trading volume has decreased by 31.23% compared to yesterday which appears to be normal.
The Week Ahead
The price of Litecoin has failed to clear the resistance of $77 this week and is ranging near the NEW record high of 1 month.
After the current consolidation wave gets over, we are looking at $80 to $85 levels as the next potential targets.
Some of the technical indicators are also giving a neutral stance.
The price of Litecoin needs to remain above the important support level of $68.98 which is a 38.2% retracement from 4-week low.
The short-term outlook for Litecoin has turned strongly bullish, the medium-term outlook is neutral, and the long-term outlook is neutral at present market conditions.
The weekly outlook is projected at $85 with a consolidation zone of $80.
Technical Indicators:
The MACD (12,26): is at 0.872 indicating a BUY
The Williams percent range: is at -21.88 indicating a BUY
The ultimate oscillator: is at 59.89 indicating a BUYThe commodity channel index (14): is at 138.89 indicating a BUY
FXOpen offers the world's most popular cryptocurrency CFDs*, including Bitcoin and Ethereum. Floating spreads, 1:2 leverage — at your service (additional fees may apply). Open your trading account now or learn more about crypto CFD trading with FXOpen.
*Important: At FXOpen UK, Cryptocurrency trading via CFDs is only available to our Professional clients. They are not available for trading by Retail clients. To find out more information about how this may affect you, please get in touch with our team.
This article represents the opinion of the Companies operating under the FXOpen brand only. It is not to be construed as an offer, solicitation, or recommendation with respect to products and services provided by the Companies operating under the FXOpen brand, nor is it to be considered financial advice.
Stay ahead of the market!
Subscribe now to our mailing list and receive the latest market news and insights delivered directly to your inbox.


Latest articles

NZD/USD Analysis: A Tug-of-War at the Critical Level
The kiwi has strengthened meaningfully against most peers this month. However, against the US dollar specifically, NZD/USD remains well below its 2026 highs, trading in the mid-0.58 area versus January's peak near 0.6075.
New Zealand's Q2 inflation

AUD/USD and USD/CAD React to Rising Geopolitical Risks
Commodity-linked currencies remain under pressure as geopolitical tensions in the Middle East continue to escalate. The United States has maintained strikes on targets in Iran, while the Tehran-backed Houthis have intensified threats to shipping in the Red Sea and near

GBP/CHF: Trendline or RSI — Which One Is Lying?
Sterling enters this week on firmer footing, with political uncertainty fading fast after Andy Burnham's confirmation as Labour leader eased investor concerns over the succession to Keir Starmer. Markets reacted further to reports pointing to Shabana Mahmood as the frontrunner