


ETHUSD Technical Analysis – 08th SEP, 2022
FXOpen
ETHUSD: Hammer Pattern Above $1490
Ethereum was unable to sustain its bearish momentum and after touching a low of 1492 on 07th Sep started to correct upwards against the US dollar, crossing the $1600 handle in the European trading session today.
We can see a continued buying pressure since yesterday and the formation of a bullish trendline from $1490 towards $1685 level.
We can clearly see a hammer pattern above the $1490 handle which is a bullish pattern and signifies the end of a bearish phase and the start of a bullish phase in the markets.
ETH is now trading just above its pivot level of 1613 and moving into a strong bullish channel. The price of ETHUSD is now testing its classic resistance level of 1630 and Fibonacci resistance level of 1647 after which the path towards 1700 will get cleared.
The relative strength index is at 58 indicating a STRONGER demand for Ether and the continuation of the uptrend in the markets.
We can see the aroon indicator giving a bullish trend in the weekly time frame.
We have also detected a moving average crossover pattern between the MA50 & MA100 in the 30-minute time frame.
The STOCHRSI is indicating an OVERSOLD market, which means that the prices are expected to correct upwards in the short-term range.
Most of the technical indicators are giving a STRONG BUY market signal.
Most of the moving averages are giving a BUY signal and we are now looking at the levels of $1700 to $1800 in the short-term range.
ETH is now trading Above both the 100 & 200 hourly simple and exponential moving averages.
- Ether: bullish reversal seen above the $1490 mark
- The short-term range appears to be strongly BULLISH
- ETH continues to remain above the $1600 levels
- The average true range is indicating LESS market volatility
Ether: Bullish Reversal Seen Above $1490

ETHUSD is moving into a strong bullish channel with the prices trading above the $1600 handle in the European trading session today.
ETH touched an intraday high of 1656 in the Asian trading session and an intraday low of 1597 in the European trading session today.
A three white soldiers pattern is visible in the 30-minutes time frame indicating the underlying bullish nature of the markets.
We can see the formation of a bullish harami cross pattern in the 15-minute time frame which indicates that now we are heading towards the $1800 mark.
The daily RSI is printing at 50 indicating a neutral demand in the long-term range.
Ethereum continues to move into a rising trend channel which is expected to continue in the short-term range.
The key support levels to watch are $1515 and $1581, and the prices of ETHUSD need to remain above these levels for the continuation of the bullish reversal in the markets.
ETH has increased by 6.68% with a price change of 101$ in the past 24hrs and has a trading volume of 18.368 billion USD.
We can see a decrease of 12.89% in the total trading volume in the last 24 hrs which appears to be normal.
The Week Ahead
On the upside the next visible targets are 1655 which is a 38.2% retracement from 4-week low, and 1726 which is a 50% retracement from 4-week high/low.
The price of Ethereum is now testing its immediate resistance zone located at $1700 and we are likely to witness a rally in the price once it touches these levels.
The immediate short-term outlook for Ether has turned strongly BULLISH, the medium-term outlook has turned NEUTRAL, and the long-term outlook for Ether is NEUTRAL in present market conditions.
The prices of ETHUSD will need to remain above the important support level of $1500 this week.
The weekly outlook is projected at $1800 with a consolidation zone of $1700.
Technical Indicators:
The relative strength index (14): is at 58.32 indicating a BUY
The moving averages convergence divergence (12,26): is at 10.23 indicating a BUY
The rate of price change: is at 3.32 indicating a BUY
The ultimate Ooscillator: is at 58.98 indicating a BUY
LTCUSD Technical Analysis – 08th SEP, 2022
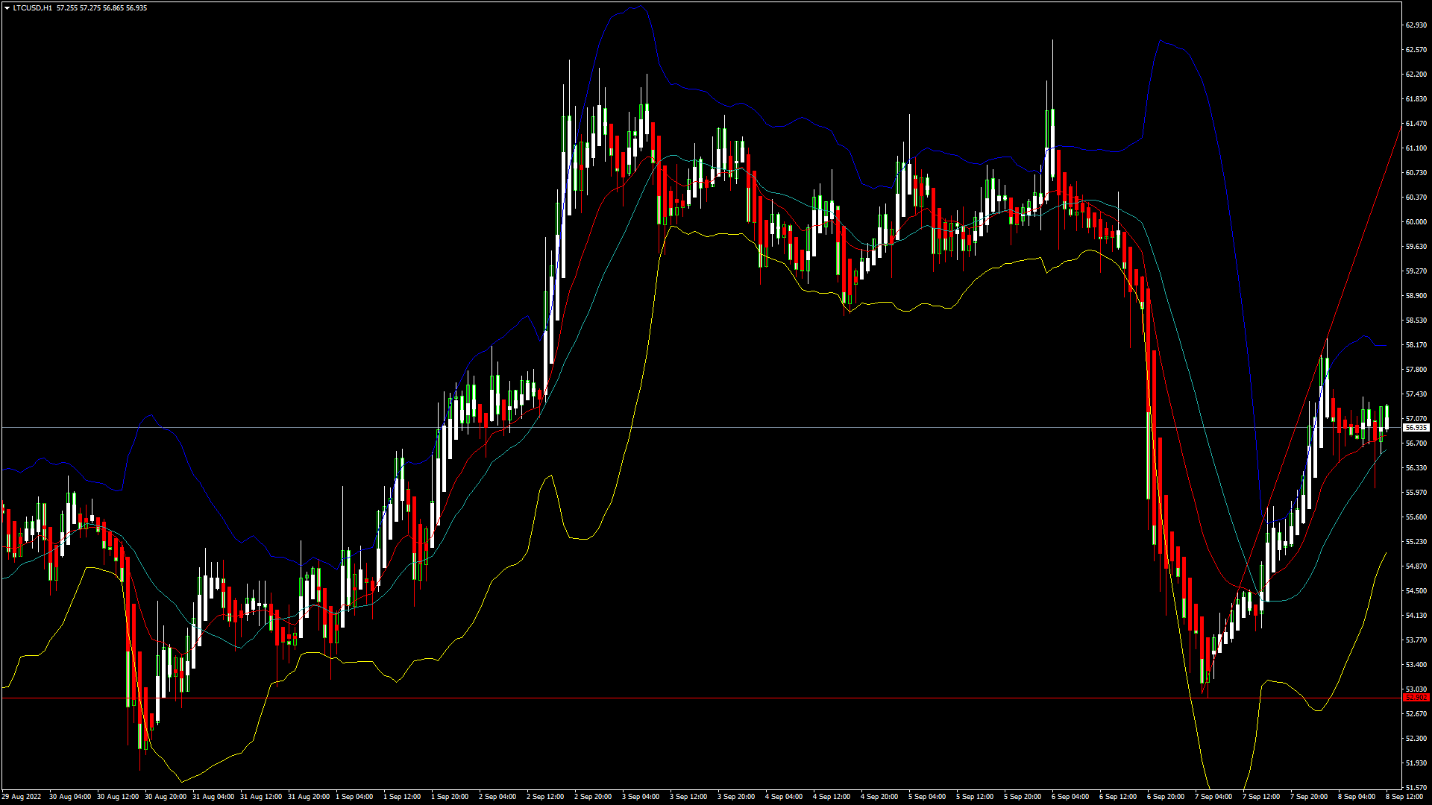
LTCUSD: Three White Soldiers Pattern Above $52.90
Litecoin was unable to sustain its bullish momentum last week and after touching a high of $62.64 on 06th Sep started to decline against the US dollar coming down below the $54 handle on 07th Sep.
Litecoin moved last week into a descending parallel channel and after finding support at $53, the price has witnessed a significant progression towards the $57 levels today.
We can clearly see a three white soldiers pattern above the $52.90 handle which is a bullish pattern and signifies the end of a bearish phase and the start of a bullish phase in the markets.
Litecoin is now trading below its 100 hourly simple moving averages and above its 200 hourly exponential moving averages. The price of LTCUSD is just below its pivot levels of 57.02
The relative strength index is at 56 indicating a STRONG market, and the continuation of the uptrend in the markets.
Litecoin touched an intraday high of $58.26 in the Asian trading session and an intraday low of $56.03in the European trading session today.
The prices of Litecoin continue to remain above most of the moving averages, which are now giving a BUY signal at current market levels of 56.94
The STOCHRSI is indicating an oversold level, which means that the prices are expected to correct upwards in the short-term range.
The short-term outlook for Litecoin has turned strongly BULLISH.
- Most of the technical indicators are giving a BUY signal
- Litecoin: bullish reversal seen above the $52.90 level
- Litecoin gains bullsih bias against the US dollar
- The average true range is indicating LESS market volatility
Litecoin: Bullish Reversal Seen Above $52.90
We can see that the price of Litecoin continues to remain in the mild bullsih phase and is trading Above the $56 handle in the European trading session today.
We can see that the parabolic SAR indicator is giving a bullsih reversal signal in the 30-minute time frame.
Both MA50 and MA100 are indicating a bullsih trend reversal in the 30-minute time frame.
The ichimoku bullsih crossover is detected in the 1-hour time frames indicating the underlying bullsih nature of the markets.
We can also see the formation of a bullsih harami pattern in the 2-hour time frame.
The price of LTCUSD is now facing its classic resistance level of 57.48 and Fibonacci resistance level of 57.71 after which the path towards $60 will get cleared.
The daily RSI is printing at 49 which is indicating a neutral demand for Litecoin and the continuation of the consolidation in the short-term range.
LTC has increased by 4.73% with a price change of 2.58$ in the past 24hrs and has a trading volume of 0.560 billion USD.
Litecoin’s trading volume has decreased by 14.87% compared to yesterday which appears to be normal.
The Week Ahead
We can see a continued progression of the bullish trend line from the $52.90 towards the $61.30 level. After touching the $60 handle more upsides are expected in the price of Litecoin towards the $62 to $65 range.
We are now looking at the important support levels of $53 and $56 in the short-term range.
The short-term outlook for Litecoin has turned mildly BULLISH, the medium-term outlook is NEUTRAL, and the long-term outlook is NEUTRAL at present market conditions.
The weekly outlook is projected at $65 with a consolidation zone of $60.
Technical Indicators:
The relative strength index (14): is at 55.77 indicating a BUY
The average directional change (14): It is at 45.15 indicating a BUY
The ultimate oscillator: is at 56.76 indicating a BUY
The rate of price change: is at 1.38 indicating a BUY
FXOpen offers the world's most popular cryptocurrency CFDs*, including Bitcoin and Ethereum. Floating spreads, 1:2 leverage — at your service (additional fees may apply). Open your trading account now or learn more about crypto CFD trading with FXOpen.
*Important: At FXOpen UK, Cryptocurrency trading via CFDs is only available to our Professional clients. They are not available for trading by Retail clients. To find out more information about how this may affect you, please get in touch with our team.
This article represents the opinion of the Companies operating under the FXOpen brand only. It is not to be construed as an offer, solicitation, or recommendation with respect to products and services provided by the Companies operating under the FXOpen brand, nor is it to be considered financial advice.
Stay ahead of the market!
Subscribe now to our mailing list and receive the latest market news and insights delivered directly to your inbox.


Latest articles

Nasdaq 100: Is This the Correction Traders Have Been Waiting For?
The Nasdaq 100 (US Tech 100 Mini on FXOpen) remains caught between two opposing forces: cooling inflation on one side, and persistent geopolitical instability on the other. On 14 July, June's CPI print came in softer than expected, easing near-term
XRP/USD: Symmetrical Triangle Forms as Trading Volume Fades
On 6 July, Ripple received a full Crypto-Asset Service Provider (CASP) licence under the Markets in Crypto-Assets (MiCA) regulation from Luxembourg's financial regulator, the CSSF. The approval allows the company to offer regulated crypto payment services across all 30 countries

AI Valuations Are Back in the Spotlight
Artificial intelligence remains the dominant investment theme of 2026, but investors are increasingly questioning whether AI stock valuations are keeping pace with reality.
💰 Big Tech continues to invest at an unprecedented scale, with hyperscaler AI spending projected to exceed $800