


EUR/USD and USD/CHF At Risk of More Losses
FXOpen

EUR/USD started another decline and traded below 1.0550. USD/CHF is consolidating and facing many hurdles near the 0.9580 zone.
Important Takeaways for EUR/USD and USD/CHF
· The Euro failed to gain pace for a move above the 1.0600 resistance zone against the US Dollar.
· There was a break below a major bullish trend line with support near 1.0550 on the hourly chart of EUR/USD.
· USD/CHF also started a fresh decline after it failed to clear the 0.9700 resistance zone.
· There is a key bearish trend line forming with resistance near 0.9565 on the hourly chart.
EUR/USD Technical Analysis
This past week, the Euro gained pace above the 1.0550 resistance zone against the US Dollar. The EUR/USD pair climbed above the 1.0580 resistance zone to move into a bullish zone.
The pair attempted a clear move above the 1.0600 resistance, but the bears remained active. The recent high was formed near 1.0615 before the pair started a fresh decline. The price declined below the 1.0550 level.
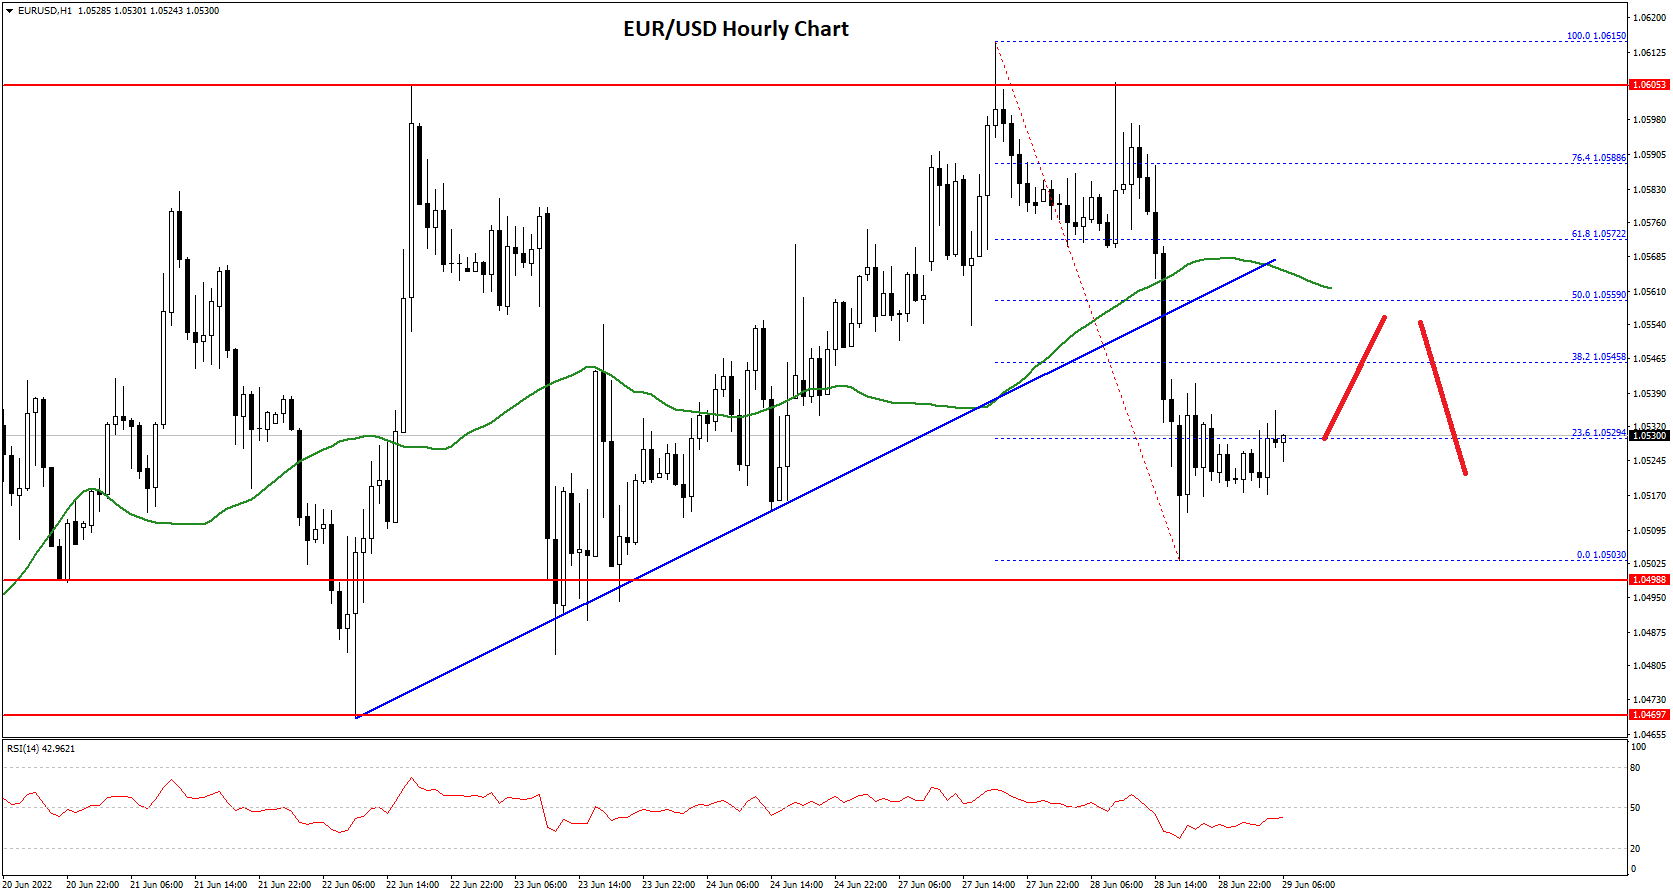
There was a break below a major bullish trend line with support near 1.0550 on the hourly chart of EUR/USD. The pair traded as low as 1.0503 on FXOpen and settled below the 50 hourly simple moving average.
It is now consolidating near 23.6% Fib retracement level of the recent decline from the 1.0615 swing high to 1.0503 low. An immediate resistance is near the 1.0540 level.
The next major resistance is near the 1.0560 level. It is close to the 50% Fib retracement level of the recent decline from the 1.0615 swing high to 1.0503 low. A clear move above the 1.0560 resistance zone could set the pace for a larger increase towards 1.0600. The next major resistance is near the 1.0650 zone.
On the downside, an immediate support is near the 1.0520 level. The next major support is near the 1.0500 level. A downside break below the 1.0500 support could start another decline.
USD/CHF Technical Analysis
The US Dollar struggled to clear the 0.9700 resistance zone and started a fresh decline against the Swiss franc. The USD/CHF pair traded below the 0.9650 support zone to move into a bearish zone.
The pair even declined below the 0.9600 level and the 50 hourly simple moving average. The recent low is formed near 0.9533 and the pair is now consolidating losses. There was a minor upward move above the 38.2% Fib retracement level of the recent decline from the 0.9620 swing high to 0.9533 low.
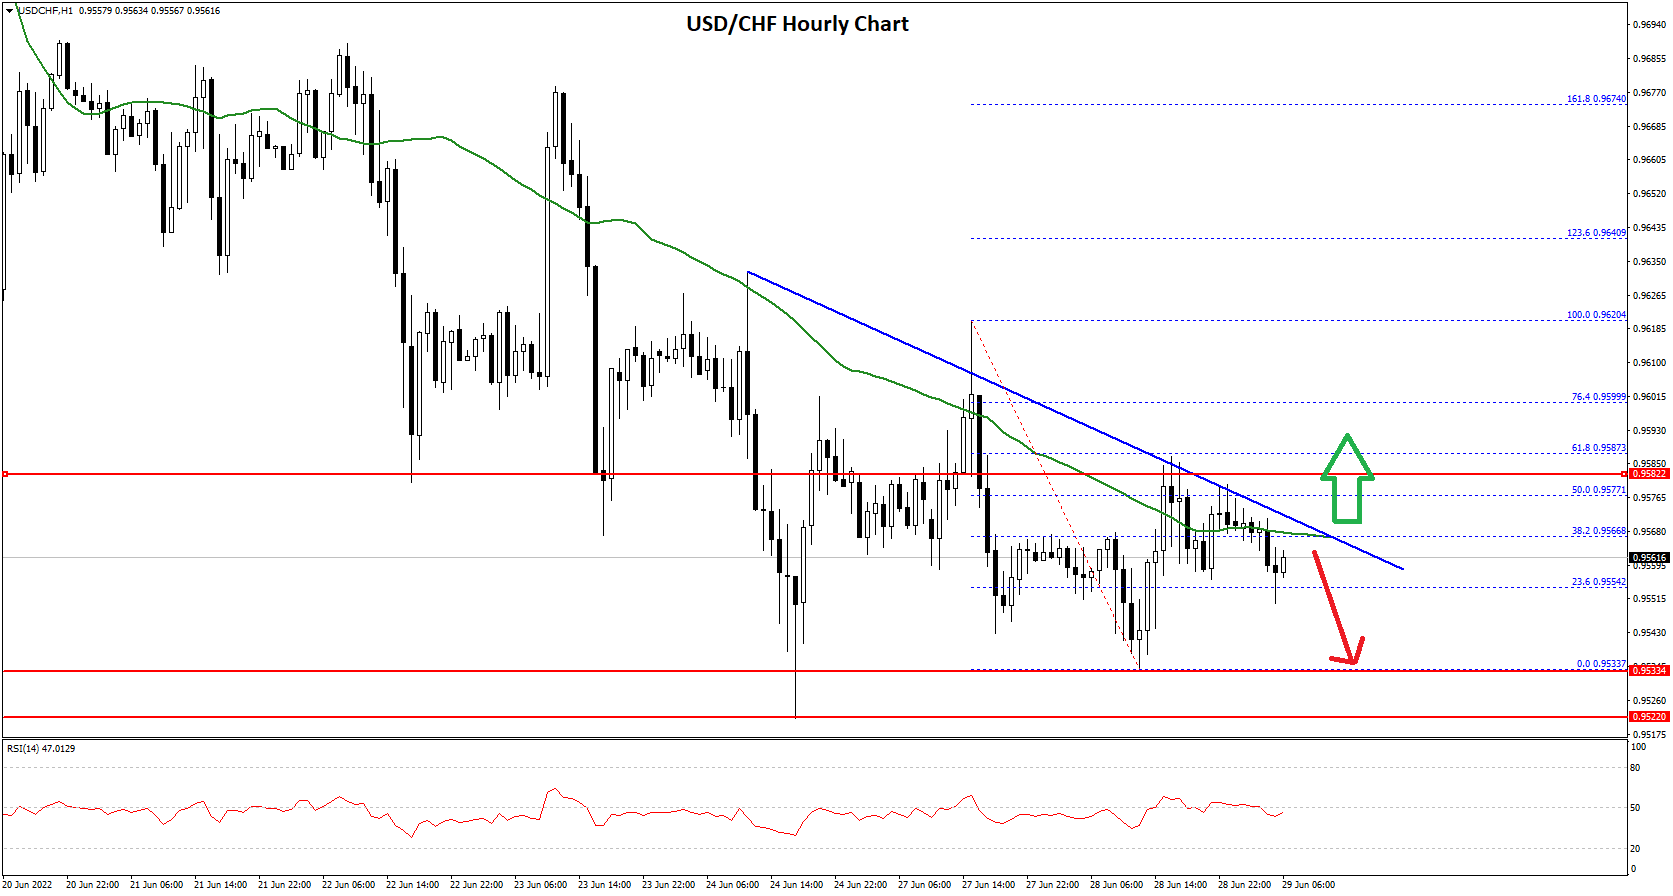
However, the pair failed to gain pace above the 50% Fib retracement level of the recent decline from the 0.9620 swing high to 0.9533 low.
There is also a key bearish trend line forming with resistance near 0.9565 on the hourly chart. The next major resistance is near the 0.9580 level. If there is a clear break above the 0.9580 resistance zone, the pair could start another increase.
If not, the pair could decline towards the 0.9530 support. The main support is now forming near the 0.9500 level. Any more losses may possibly open the doors for a move towards the 0.9440 level.
This forecast represents FXOpen Markets Limited opinion only, it should not be construed as an offer, invitation or recommendation in respect to FXOpen Markets Limited products and services or as financial advice.
Trade over 50 forex markets 24 hours a day with FXOpen. Take advantage of low commissions, deep liquidity, and spreads from 0.0 pips (additional fees may apply). Open your FXOpen account now or learn more about trading forex with FXOpen.
This article represents the opinion of the Companies operating under the FXOpen brand only. It is not to be construed as an offer, solicitation, or recommendation with respect to products and services provided by the Companies operating under the FXOpen brand, nor is it to be considered financial advice.
Stay ahead of the market!
Subscribe now to our mailing list and receive the latest market news and insights delivered directly to your inbox.


Latest articles

Ripple: Letter to Congress Stirs the Crypto Market
At the beginning of June, more than 200 crypto companies and industry groups — including Coinbase, Andreessen Horowitz and Ripple Labs — sent a letter to Senate Majority and Minority Leaders John Thune and Chuck Schumer, urging them to bring the Digital

GBP/JPY: Ascending Triangle Under Pressure
The GBP/JPY pair has come under pressure after the Bank of Japan raised its policy rate to 1.0% on 16 June. The Bank of England is following the opposite path: at its 30 April meeting, the Monetary Policy

Pound Under Pressure: Markets Await Bank of England And SNB Decisions
The British pound remains under pressure following weaker-than-expected inflation data, which has reinforced expectations of further monetary easing by the Bank of England. Investors are staying cautious ahead of today’s policy meetings of both the UK central bank and