


EUR/USD And USD/CHF Setting Up For Next Break
FXOpen
EUR/USD remained well bid above the 1.0980 and 1.1000 levels and it could continue to rise. USD/CHF is currently holding an important support and it could climb above 1.0000.
Important Takeaways for EUR/USD and USD/CHF
- The Euro is showing positive signs above the key 1.0980 support area against the US Dollar.
- There is a major bearish trend line forming with resistance near 1.1040 on the hourly chart of EUR/USD.
- USD/CHF is facing a strong resistance near the 0.9990 and 1.0000 levels.
- There is a crucial bullish trend line forming with support near 0.9970 on the hourly chart.
EUR/USD Technical Analysis
Recently, there was an upward move in the Euro above the 1.1020 resistance against the US Dollar. The EUR/USD pair traded above the 1.1040 level, but it struggled to clear the 1.1060 resistance area.
A swing high was formed near 1.1060 on FXOpen and the pair corrected lower below the 50 hourly simple moving average. The pair traded below the 1.1020 support area and tested the 1.0990 area.
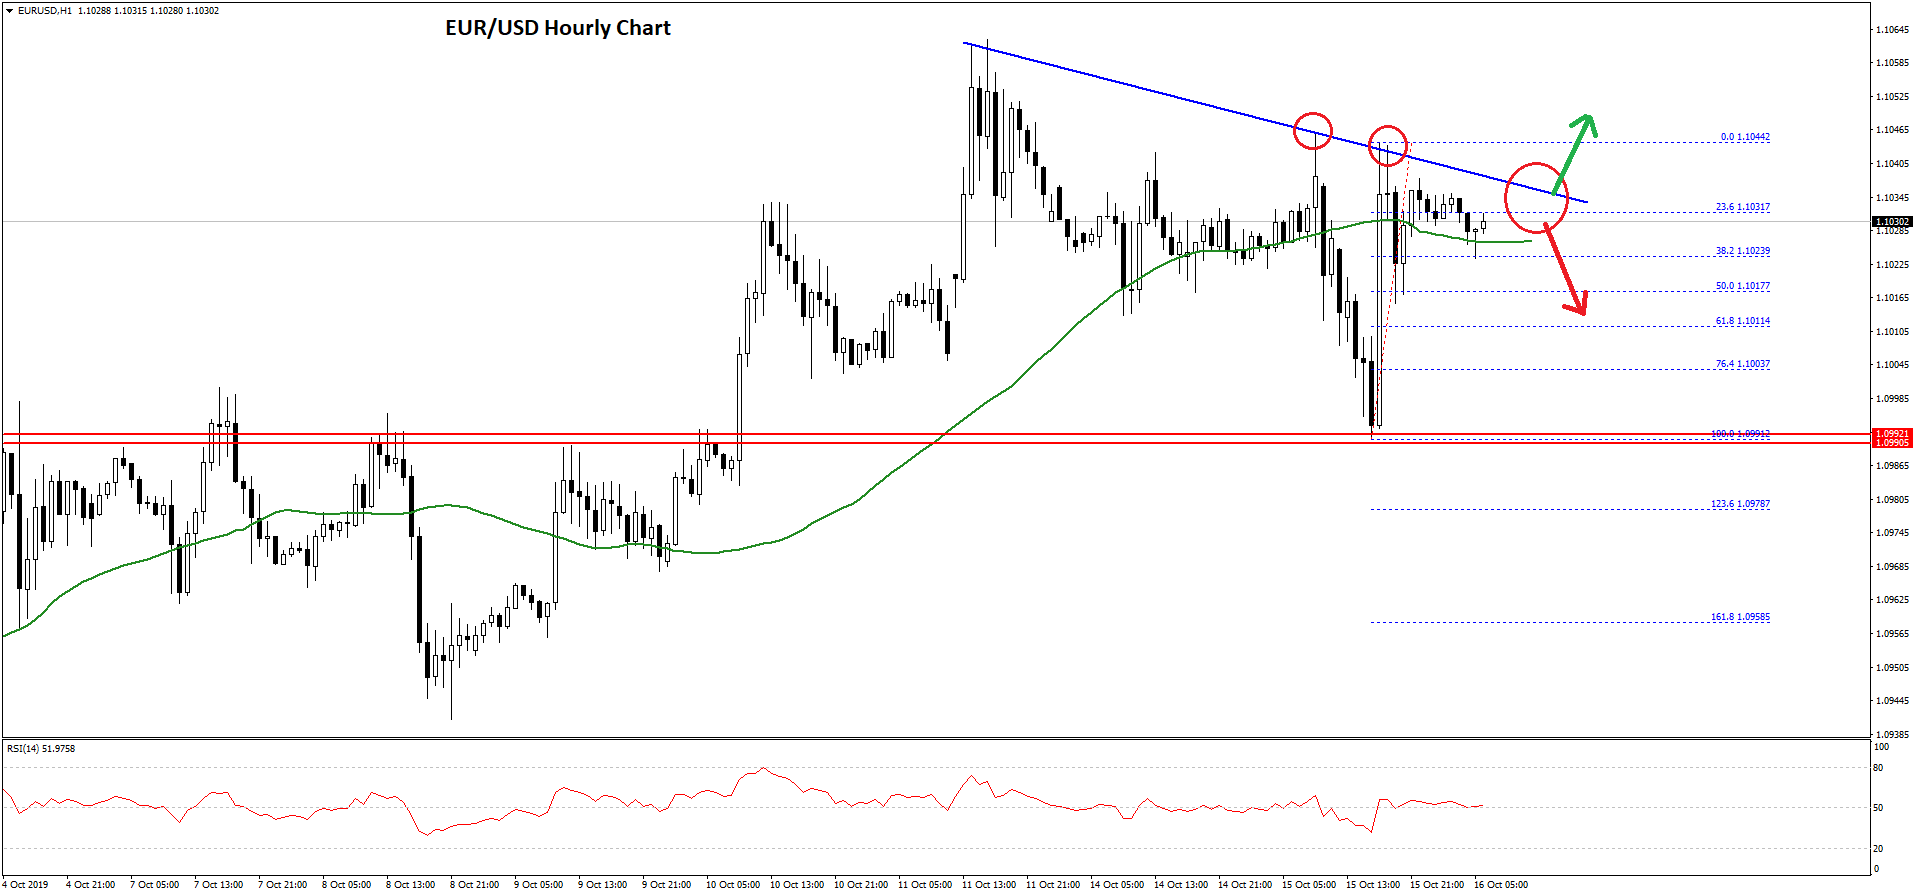
A low was formed near 1.0991 and the pair is currently climbing higher. The recent high was 1.1044 and the pair is trading near the 50 hourly SMA. Moreover, it tested the 38.2% Fib retracement level of the recent wave from the 1.0991 low to 1.1044 high.
On the upside, there is a strong resistance forming near the 1.1040 level. Besides, there is a major bearish trend line forming with resistance near 1.1040 on the hourly chart of EUR/USD.
If there is an upside break above the 1.1040 resistance, the pair could revisit the 1.1060 resistance. Any further gains could push the pair towards the 1.1080 level.
On the downside, an immediate support is near the 1.1015 level. It coincides with the 50% Fib retracement level of the recent wave from the 1.0991 low to 1.1044 high.
The main supports for EUR/USD are near 1.1000 and 1.0980, below which the pair could resume its decline and trade towards the 1.0950 level in the near term.
USD/CHF Technical Analysis
The US Dollar remained in a positive zone above the 0.9900 pivot level against the Swiss franc. The USD/CHF pair even climbed above the 0.9950 resistance, with mostly steady moves.
The upward move was such that the pair climbed above the 0.9980 resistance and the 50 hourly simple moving average. The pair traded close to the 1.0000 resistance and a high was formed near 0.9995.
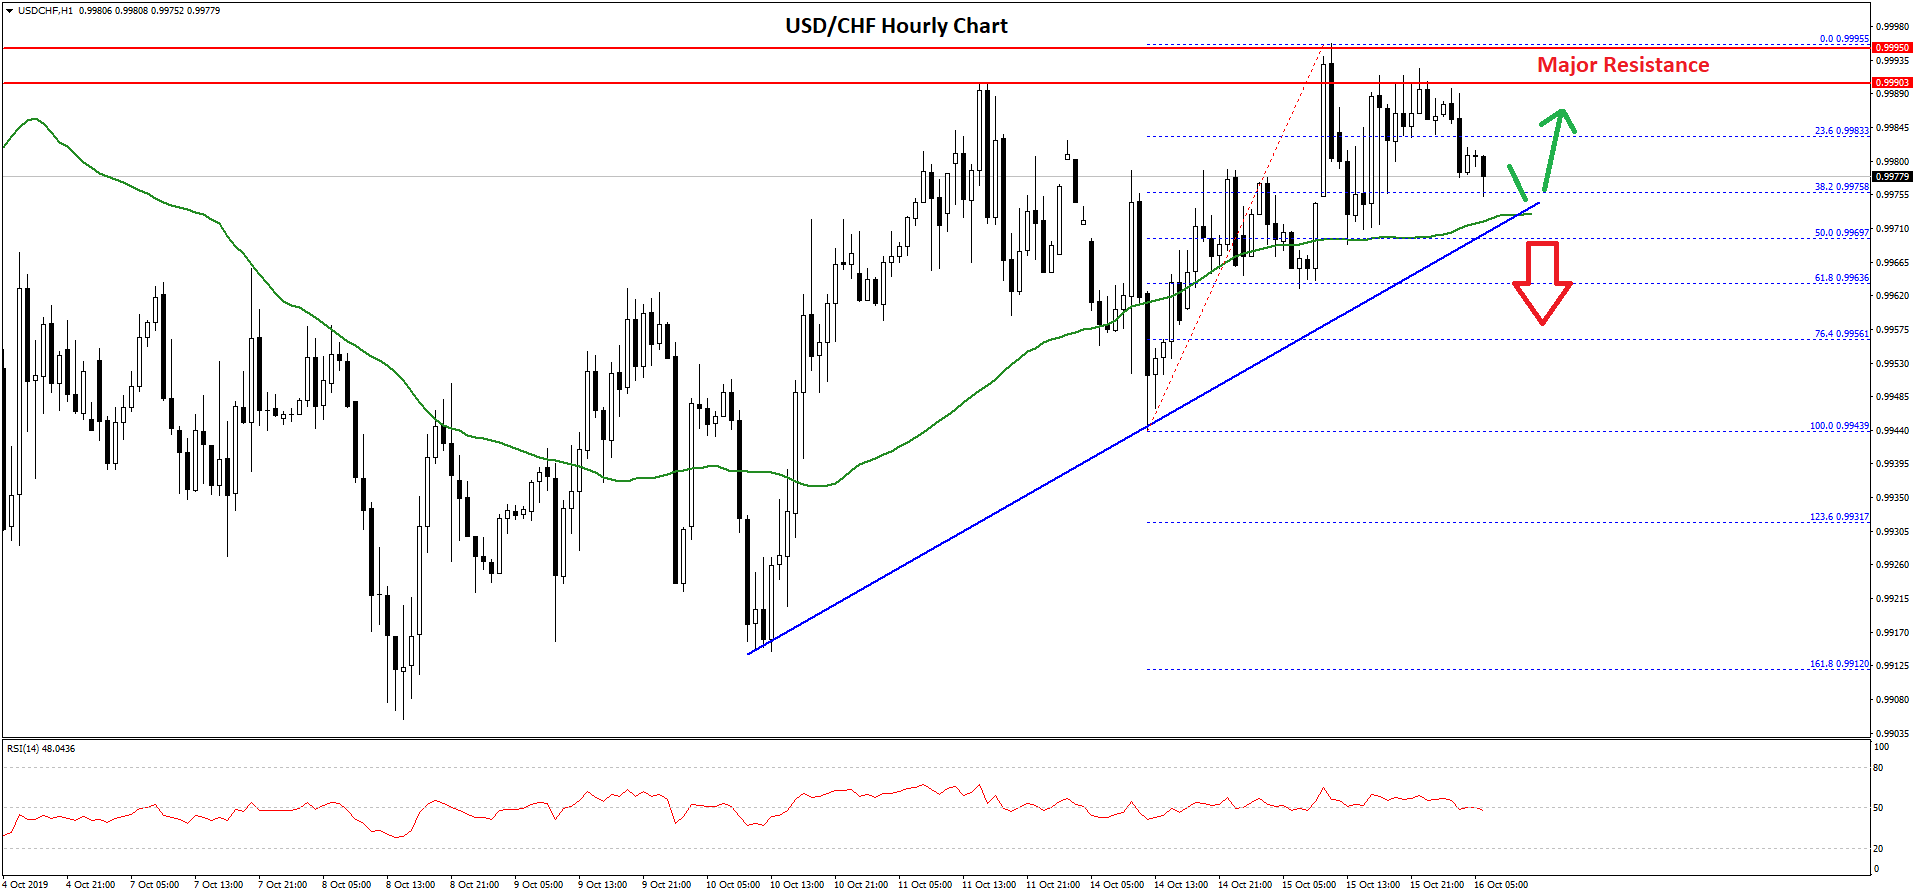
However, the pair failed to continue higher and declined below the 0.9985 level. There was a break below the 23.6% Fib retracement level of the last wave from the 0.9943 low to 0.9995 high.
There are key supports near the 0.9970 and 0.9975 levels. Moreover, the 50 hourly SMA is currently acting as a support near 0.9975. Besides, there is a crucial bullish trend line forming with support near 0.9970 on the hourly chart.
Additionally, the 50% Fib retracement level of the last wave from the 0.9943 low to 0.9995 high is also near 0.9970. Therefore, a break below the 0.9970 support level might push USD/CHF towards the 0.9950 support area.
On the upside, the main hurdle is near the 0.9990 and 1.0000 levels, above which there could be a sharp rise in the near term.
Trade over 50 forex markets 24 hours a day with FXOpen. Take advantage of low commissions, deep liquidity, and spreads from 0.0 pips (additional fees may apply). Open your FXOpen account now or learn more about trading forex with FXOpen.
This article represents the opinion of the Companies operating under the FXOpen brand only. It is not to be construed as an offer, solicitation, or recommendation with respect to products and services provided by the Companies operating under the FXOpen brand, nor is it to be considered financial advice.
Stay ahead of the market!
Subscribe now to our mailing list and receive the latest market news and insights delivered directly to your inbox.


Latest articles

EUR/USD Eyes Gains As USD/CHF Weakness Deepens Again
EUR/USD started a fresh increase above 1.1700 and 1.1720. USD/CHF declined further and is now struggling below 0.7835.
Important Takeaways for EUR/USD and USD/CHF Analysis Today
· The Euro started a decent increase from

Apple: Earnings Day Above the Activity Zone
On 30 April, after the market close, Apple Inc. will release its financial results for the second quarter of fiscal 2026. The consensus forecast, based on estimates from 31 analysts, points to revenue of around $109.7 billion, with expected

USD/JPY and USD/CHF Near Key Levels: The Dollar Supported by the Fed
The US dollar continues to trend upwards following the Federal Reserve meeting, drawing support from the regulator’s moderately hawkish stance and comments by Jerome Powell. Markets interpret the Fed’s rhetoric as a signal that restrictive policy is likely