EUR/USD and USD/JPY Eyeing More Upsides
EUR/USD rallied towards the 1.1350 level before correcting lower. USD/JPY is currently trading above the 107.50 support and the bulls seem to be aiming a break above 108.00.
Important Takeaways for EUR/USD and USD/JPY
- The Euro started a fresh increase above the 1.1250 and 1.1300 resistance levels.
- There is a key contracting triangle forming with resistance near 1.1290 on the hourly chart of EUR/USD.
- USD/JPY is currently facing a strong resistance near the 107.80 and 108.00 levels.
- There was a break above a major bearish trend line with resistance near 107.50 on the hourly chart.
EUR/USD Technical Analysis
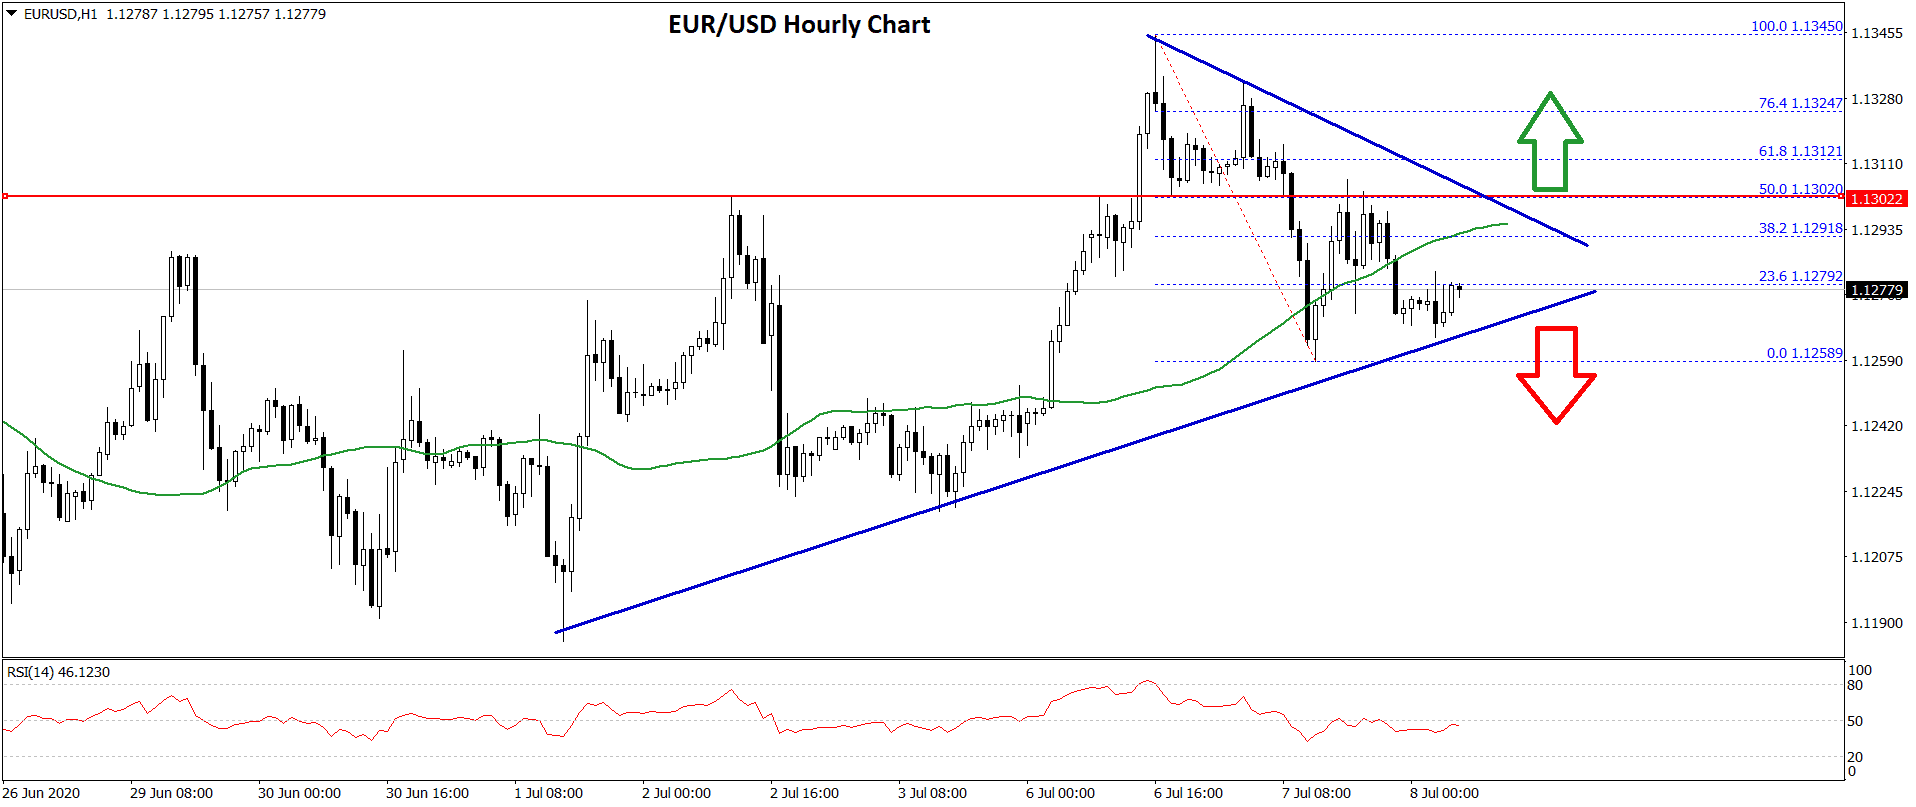
In the past few days, the Euro followed a bullish path above the 1.1220 level against the US Dollar. The EUR/USD pair traded above the 1.1250 resistance level to move into a positive zone.
The upward move was such that the pair surpassed the 1.1300 level and settled above the 50 hourly simple moving average. It traded as high as 1.1345 on FXOpen and recent corrected lower.
It tested the 1.1250 support level and now preparing for the next move. An initial resistance is near the 1.1290 level and the 50 hourly SMA. It is also close to the 38.2% Fib retracement level of the recent decline from the 1.1345 high to 1.1258 low.
More importantly, there is a key contracting triangle forming with resistance near 1.1290 on the hourly chart of EUR/USD. The 50% Fib retracement level of the recent decline from the 1.1345 high to 1.1258 low is just above the triangle resistance.
Therefore, an upside break above the triangle resistance and 1.1300 could open the doors for a fresh rally. The next major resistance is near the 1.1350 level, above which the pair might test 1.1400.
Conversely, EUR/USD could decline below the 1.1260 and 1.1250 support levels. In the mentioned case, the pair may perhaps decline steadily towards the 1.1200 level.
USD/JPY Technical Analysis
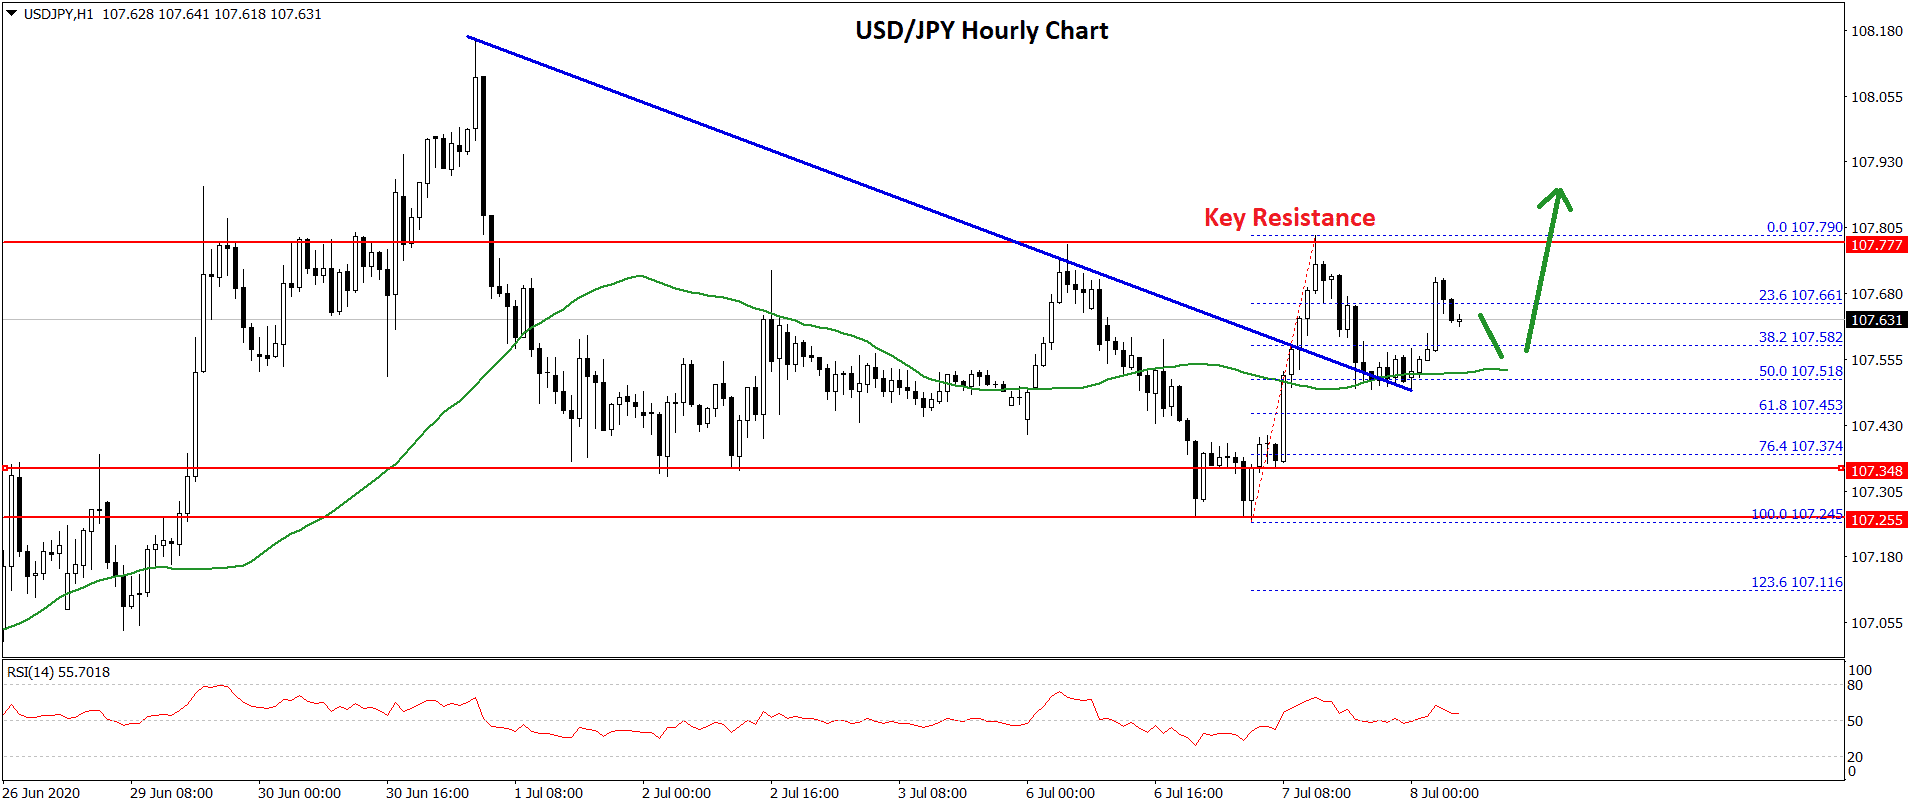
The US Dollar started a steady decline from well above the 108.00 area against the Japanese Yen. The USD/JPY pair traded below the 107.50 support and tested the 107.25 area.
A swing low was formed near 107.24 and the pair recently settled above the 50 hourly simple moving average. During the rise, there was a break above a major bearish trend line with resistance near 107.50 on the hourly chart.
It retested the 107.80 resistance level and corrected lower. There was a break below the 38.2% Fib retracement level of the recent rise from the 107.24 low to 107.79 high.
However, the 107.50 support area is acting as a strong buy zone along with the 50 hourly SMA. The 50% Fib retracement level of the recent rise from the 107.24 low to 107.79 high is also acting as a support.
If the pair fails to stay above the 107.50 support, there is a risk of more losses below the 107.25 and 107.20 support levels. The next key support on the downside is seen near the 106.80 level.
On the upside, there are many hurdles forming near the 107.80 level. The main resistance is still near the 108.00 level, above which USD/JPY is likely to gain bullish momentum towards the 108.80 resistance level in the coming sessions.