EUR/USD and USD/JPY Primed for More Gains Feb 2019
EUR/USD started a decent recovery and moved above the 1.1320 resistance area. USD/JPY is gaining bullish momentum and it might break the 110.80 resistance.
Important Takeaways for EUR/USD and USD/JPY
- The Euro found support near the 1.1260 level and later recovered above 1.1300.
- There was a break above a crucial bearish trend line with resistance at 1.1295 on the hourly chart of EUR/USD.
- USD/JPY broke a key contracting triangle with resistance at 110.55 on the hourly chart.
- The pair is gaining momentum and it could climb towards the 111.00 resistance in the near term.
EUR/USD Technical Analysis
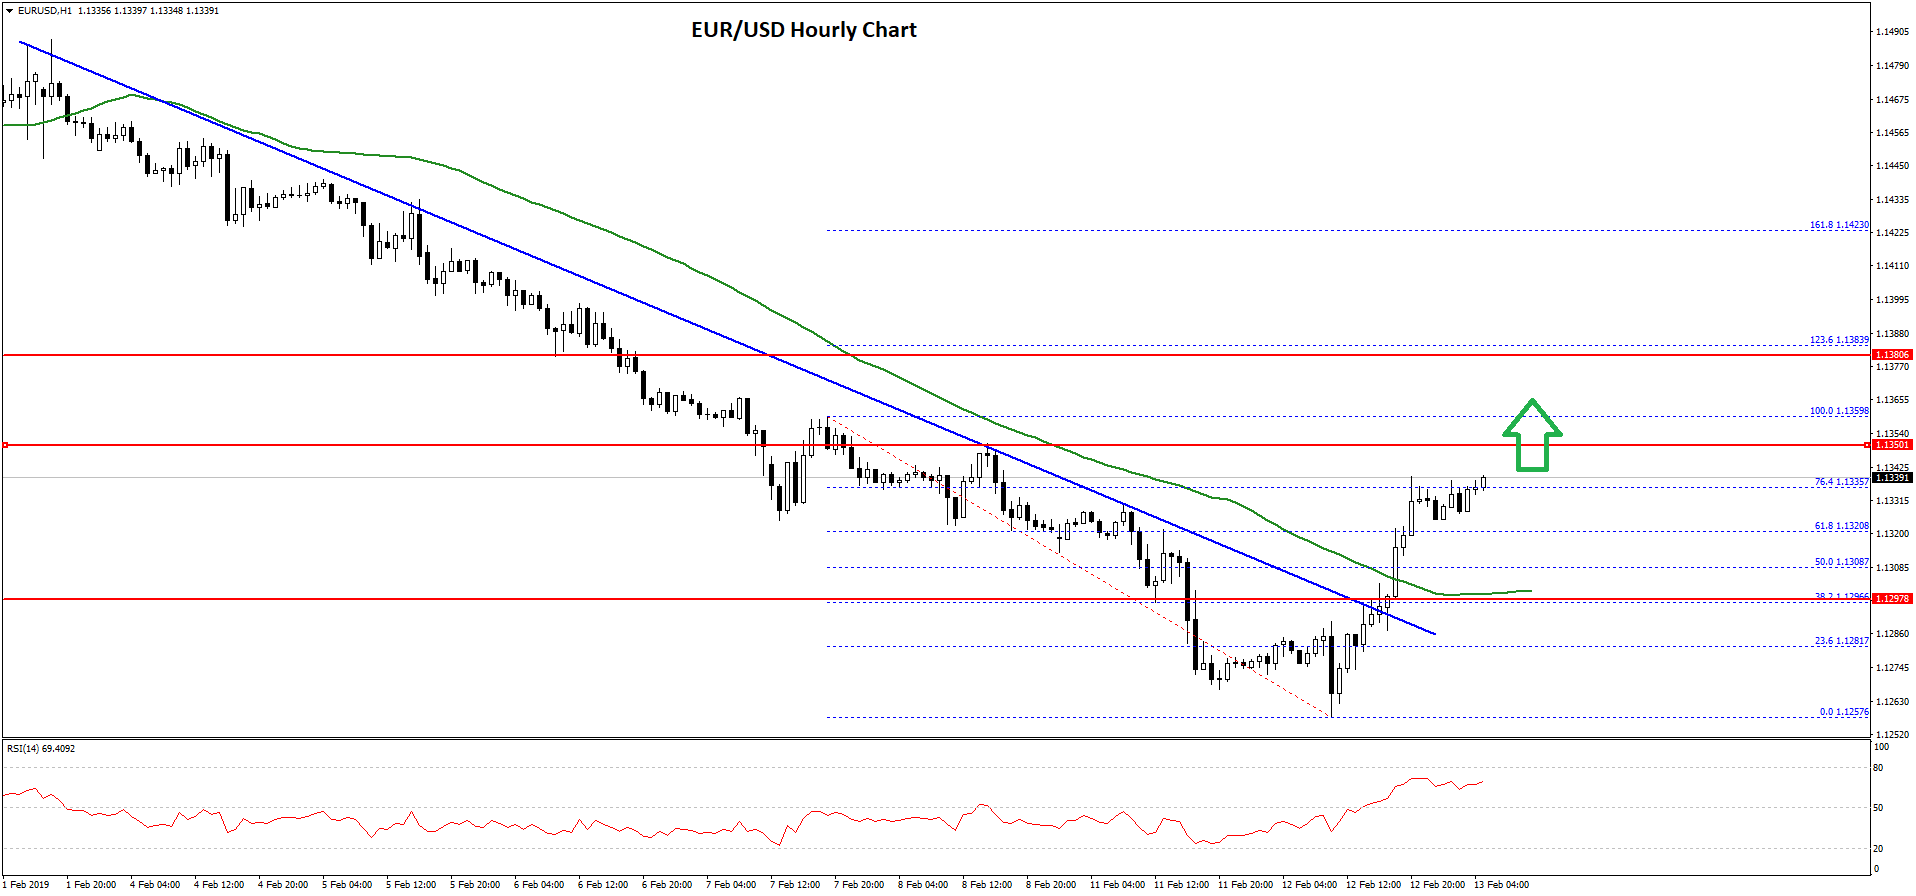
There was a strong downtrend recently in the Euro from the 1.1480 swing high against the US Dollar. The EUR/USD pair broke many support levels such as 1.1450, 1.1400, 1.1320 and 1.1300.
The pair even broke the 1.1280 support and formed a low at 1.1257 on FXOpen. Later, the pair started a decent upside correction and traded above the 1.1280 and 1.1300 resistance levels. There was even a close above the 1.1300 level and the 50 hourly simple moving average.
During the recovery, there was a break above a crucial bearish trend line with resistance at 1.1295 on the hourly chart of EUR/USD. The pair even surpassed the 61.8% Fib retracement level of the recent decline from the 1.1359 high to 1.1257 low.
The pair is currently trading nicely above 1.1320 and it may continue to move towards the 1.1350 or 1.1360 resistance levels. If there are more gains, the pair could trade towards the 1.1380 resistance area.
The 1.236 Fib extension level of the recent decline from the 1.1359 high to 1.1257 low is also near the 1.1380 level to act as a resistance.
If there is a downside correction, the pair might find support near the 1.1310 level. However, the main support is near the 1.1300 level and the 50 hourly simple moving average.
USD/JPY Technical Analysis
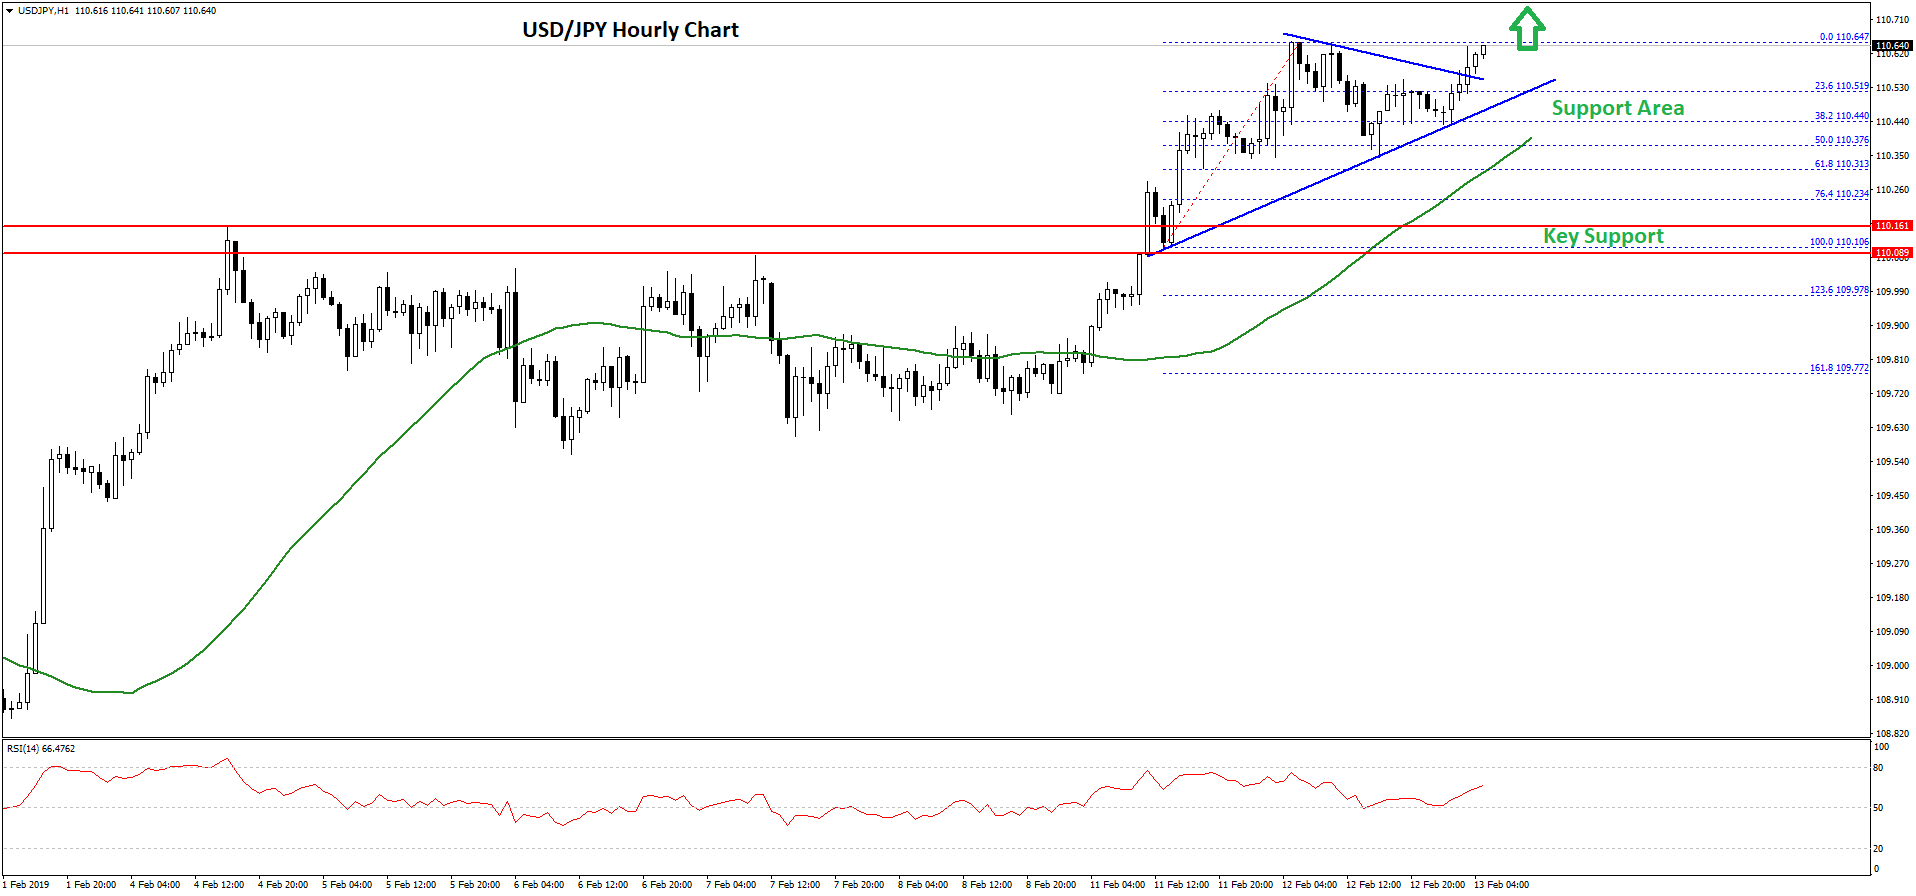
The US Dollar consolidated for a few sessions below the 110.00 and 110.10 resistance levels against the Japanese Yen. However, the USD/JPY pair finally gained traction and broke the 110.10 resistance to start a solid upward move.
Buyers pushed the price above the 110.30 resistance and the 50 hourly simple moving average. It traded as high as 110.64 and later there was a short term downside correction. The pair dipped below the 23.6% Fib retracement level of the last wave from the 110.10 low to 110.64 high.
However, the decline was protected by the 110.35 level and the 50% Fib retracement level of the last wave from the 110.10 low to 110.64 high.
Finally, the USD/JPY pair broke a key contracting triangle with resistance at 110.55 on the hourly chart. It seems like the pair is gaining pace above 110.50 and it may continue to rise towards the 110.80 and 111.00 resistance levels.
On the other hand, if there is a downside correction, an initial support is seen near the 110.50 level. A break below the 110.50 support could push the pair back towards the 110.35 support and the 50 hourly SMA in the near term.