


EUR/USD Climbing Higher While USD/JPY Tumbles
FXOpen
EUR/USD is currently trading nicely above the 1.1160 and 1.1180 support levels. USD/JPY declined heavily recently and broke the 110.80 and 110.50 support levels.
Important Takeaways for EUR/USD and USD/JPY
- The Euro corrected lower recently and tested the 1.1160-1.1165 support area.
- There is a major bearish trend line in place with resistance near 1.1208 on the hourly chart of EUR/USD.
- USD/JPY declined heavily and settled below the key 110.50 support area.
- There is a key bearish trend line formed with resistance at 110.35 on the hourly chart.
EUR/USD Technical Analysis
The Euro started a fresh upward move after testing the 1.1135 level against the US Dollar. The EUR/USD pair broke the 1.1150 and 1.1160 resistance levels to move into a positive zone.
The pair traded as high as 1.1217 on FXOpen and recently corrected below the 1.1180 level. However, the 1.1160-1.1165 area acted as a support and the pair bounced back. It is now trading above the 1.1185 level and the 50 hourly simple moving average.
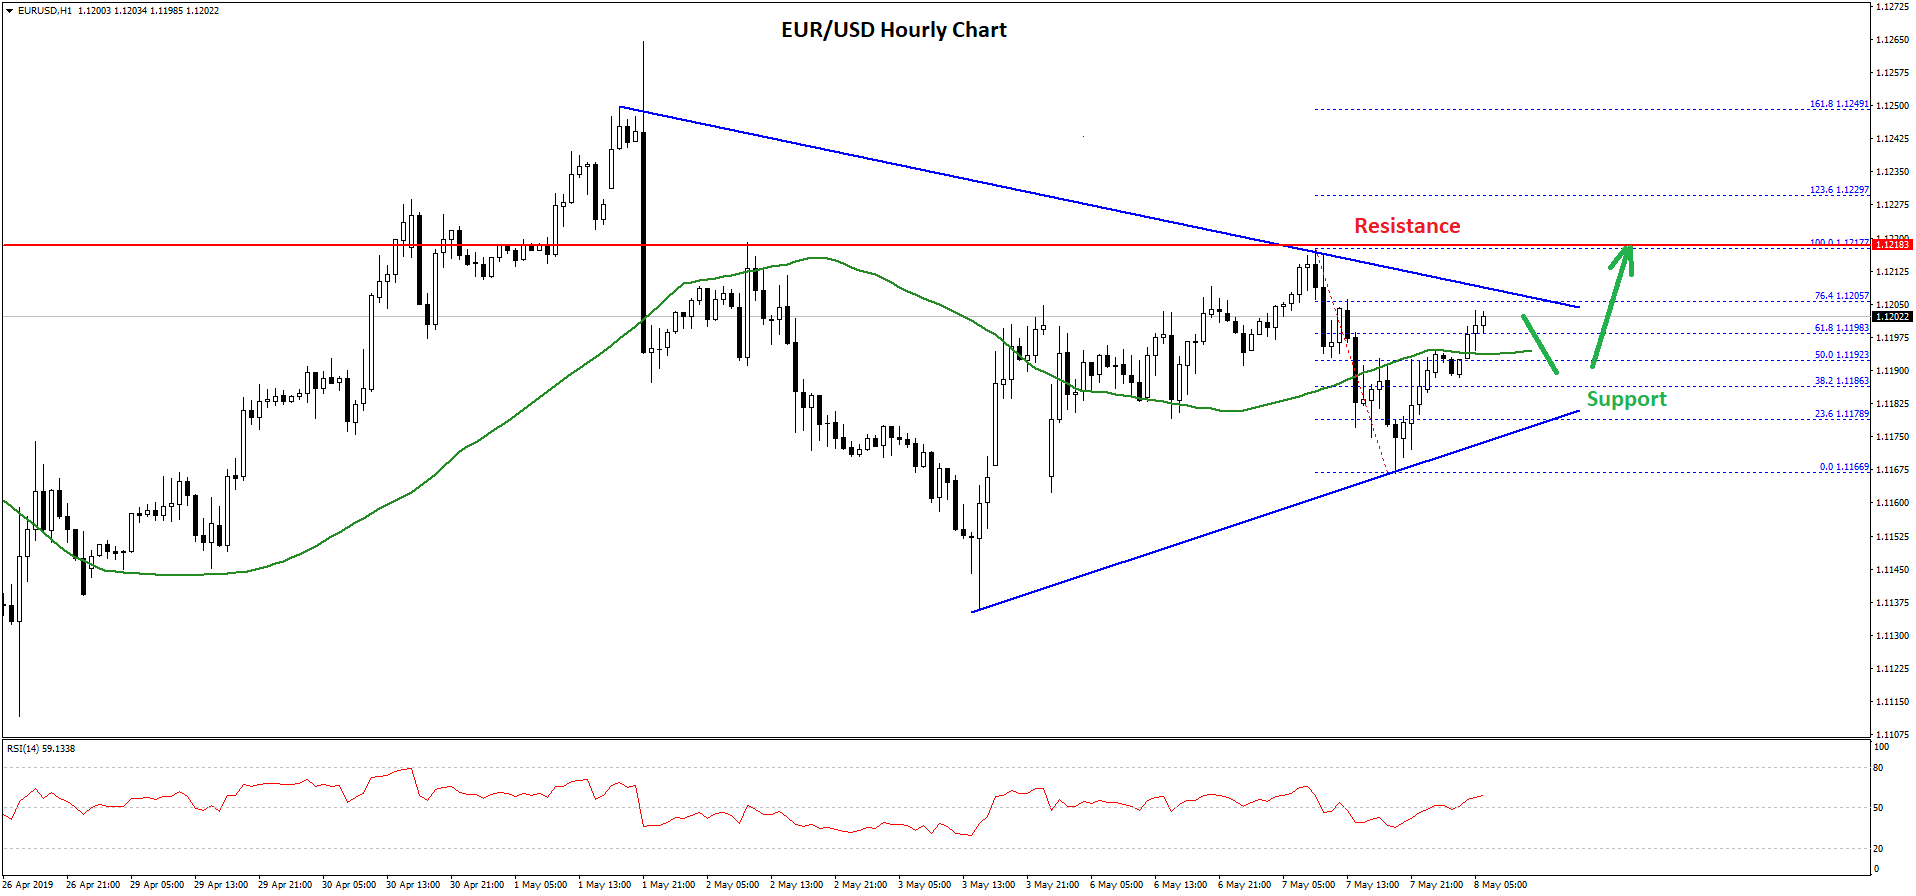
There was a break above the 50% Fib retracement level of the recent decline from the 1.1217 high to 1.1166 low. On the upside, there is a major resistance formed near 1.1208-1.1210. There is also a major bearish trend line in place with resistance near 1.1208 on the hourly chart of EUR/USD.
At the moment, the pair is near the 76.4% Fib retracement level of the recent decline from the 1.1217 high to 1.1166 low. A clear break above the trend line and the 1.1210 level may push the price towards the 1.1220 resistance.
Any further gains above 1.1220 is likely to lead the Euro towards the 1.1250 level. On the downside, an initial support is near the 1.1190 and the 50 hourly SMA. However, the main support is near the 1.1180 level and a connecting bullish trend line.
A daily close below 1.1180 and 1.1165 is likely to push EUR/USD back in a bearish zone in the near term towards 1.1120.
USD/JPY Technical Analysis
The US Dollar started the week on a negative note below 111.00 against the Japanese Yen. The USD/JPY pair opened with a gap lower and broke the key 110.80 support level to enter a bearish zone.
There was a steady decline and the pair settled below the 110.50 level and the 50 hourly simple moving average. During the decline, the pair formed a few bearish patterns on the hourly chart and recently traded as low as 109.96.
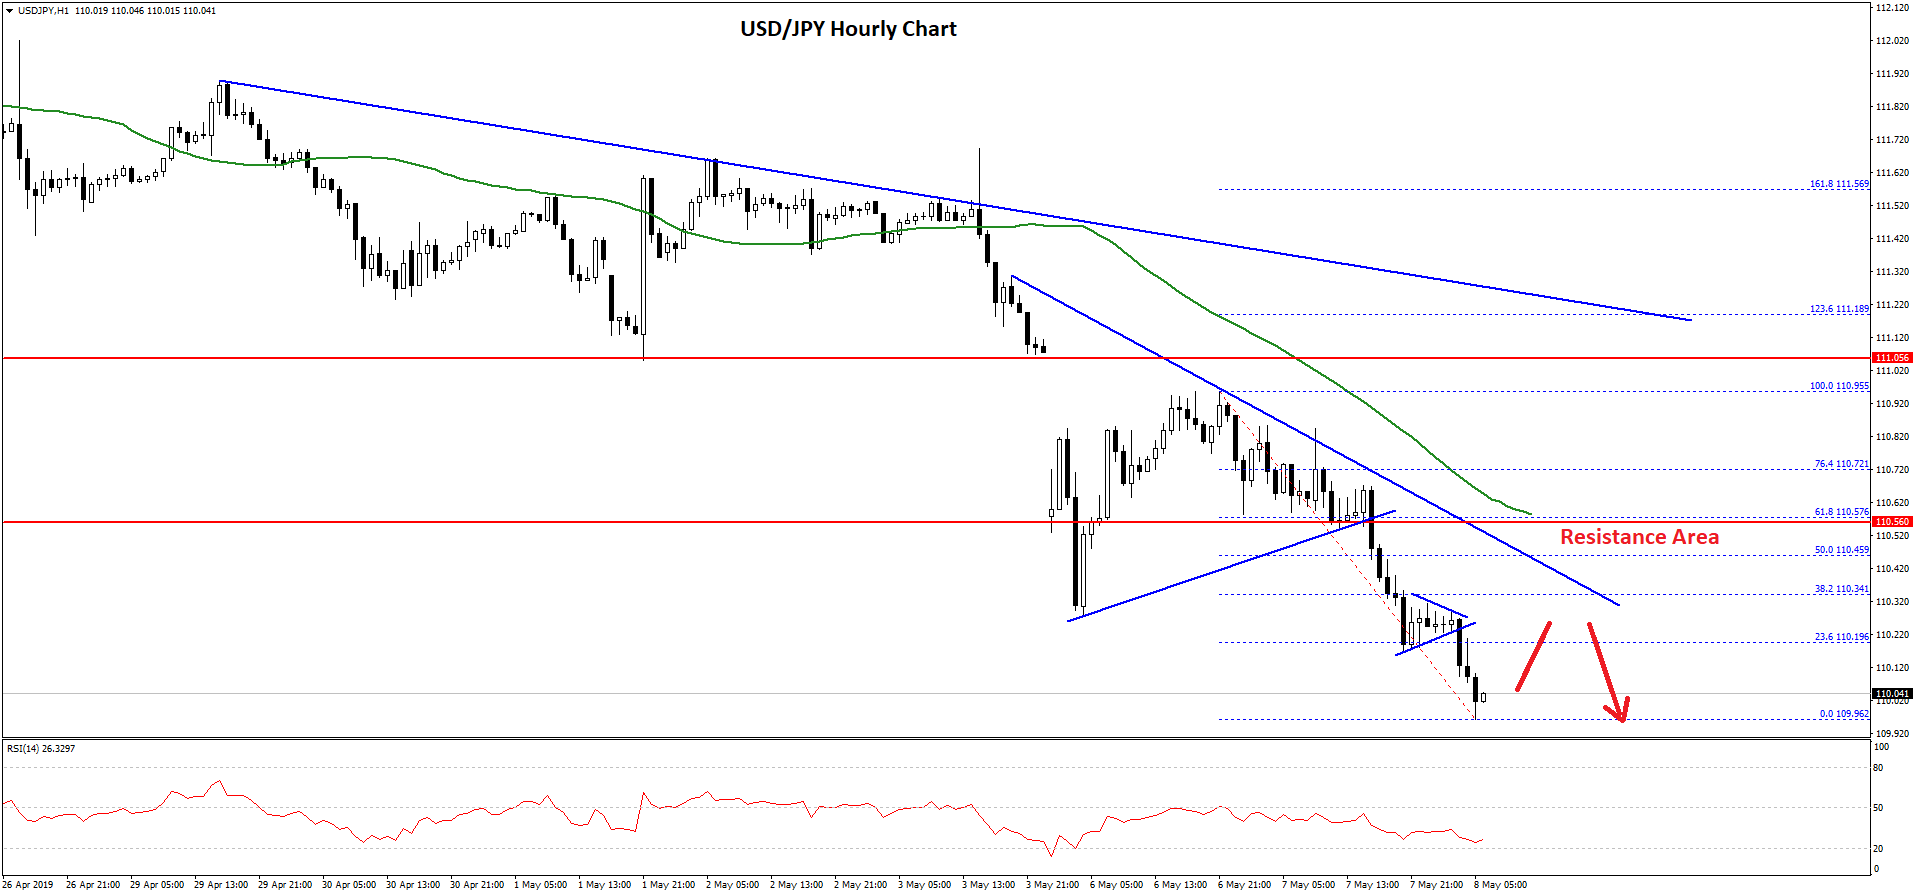
It is currently trading in a bearish zone, with an immediate resistance near 110.20, and the 23.6% Fib retracement level of the recent decline from the 110.95 high to 109.96 low.
On the upside, there is a key bearish trend line formed with resistance at 110.35 on the hourly chart. The trend line is close to the 38.2% Fib retracement level of the recent decline from the 110.95 high to 109.96 low.
The next key resistances are near the 110.50 and 110.55 levels. The 50 hourly simple moving average is also positioned near the 110.55 level. Therefore, a decent recovery won’t be easy in the near term.
On the downside, an initial support is near 110.00, below which USD/JPY could decline towards the 109.80 level or even test the 109.60 support.
Trade over 50 forex markets 24 hours a day with FXOpen. Take advantage of low commissions, deep liquidity, and spreads from 0.0 pips (additional fees may apply). Open your FXOpen account now or learn more about trading forex with FXOpen.
This article represents the opinion of the Companies operating under the FXOpen brand only. It is not to be construed as an offer, solicitation, or recommendation with respect to products and services provided by the Companies operating under the FXOpen brand, nor is it to be considered financial advice.
Stay ahead of the market!
Subscribe now to our mailing list and receive the latest market news and insights delivered directly to your inbox.


Latest articles

Apple: Earnings Day Above the Activity Zone
On 30 April, after the market close, Apple Inc. will release its financial results for the second quarter of fiscal 2026. The consensus forecast, based on estimates from 31 analysts, points to revenue of around $109.7 billion, with expected

USD/JPY and USD/CHF Near Key Levels: The Dollar Supported by the Fed
The US dollar continues to trend upwards following the Federal Reserve meeting, drawing support from the regulator’s moderately hawkish stance and comments by Jerome Powell. Markets interpret the Fed’s rhetoric as a signal that restrictive policy is likely

EUR/USD and GBP/USD consolidate ahead of the Fed decision
European currencies are showing subdued dynamics, entering a consolidation phase following their previous advance. Earlier, EUR/USD and GBP/USD broke out of their ranges and strengthened; however, the subsequent correction has led both pairs to retest the previously breached