


EUR/USD Correcting Lower While USD/CHF Climbs Steadily
FXOpen

EUR/USD failed to clear the 1.1800 resistance zone and started a downside correction. USD/CHF is correcting higher and showing positive signs above 0.9165.
Important Takeaways for EUR/USD and USD/CHF
- The Euro failed once again to clear the key 1.1800 resistance zone against the US Dollar.
- There was a break below a major bullish trend line with support near 1.1740 on the hourly chart of EUR/USD.
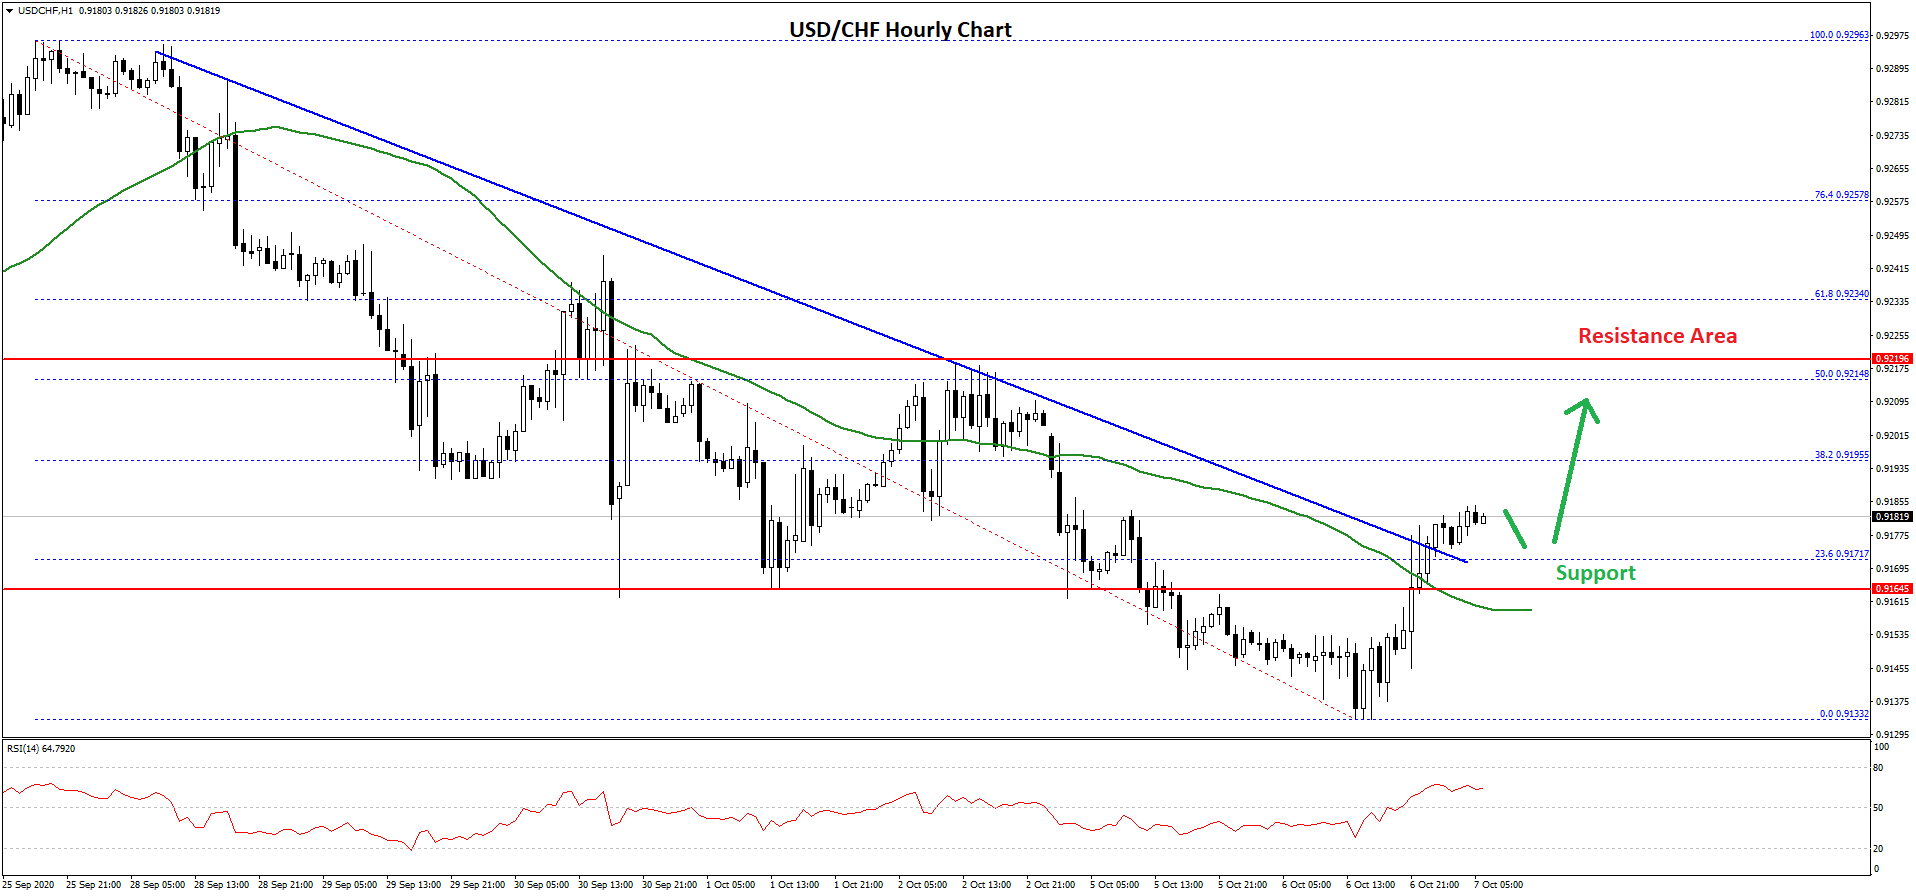
- USD/CHF traded as low as 0.9133 and recently started an upside correction.
- There was a break above a key bearish trend line with resistance near 0.9175 on the hourly chart.
EUR/USD Technical Analysis
This week, the Euro made a few attempts to clear the 1.1800 resistance zone against the US Dollar. The EUR/USD pair failed to extend gains and started a fresh decline.
A high was formed near 1.1807 on FXOpen before the pair broke the 1.1780 support level. There was a clear break below the 1.1765 support level and the 50 hourly simple moving average to start the current decline.
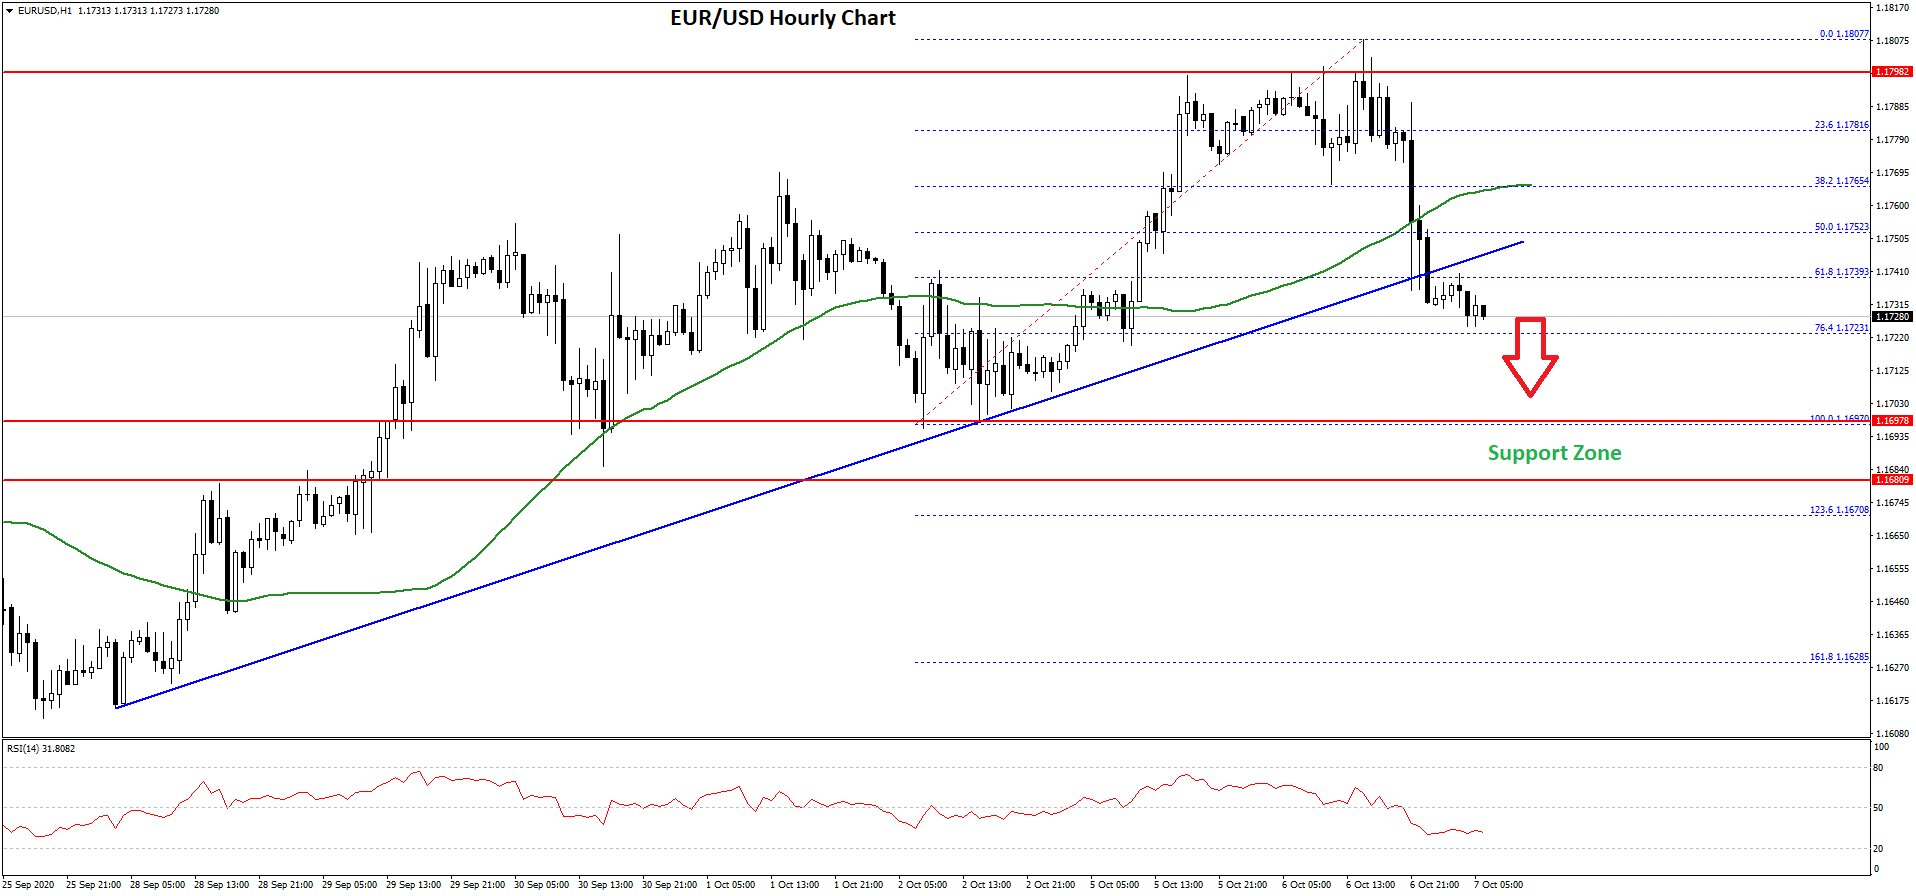
The pair even broke the 50% Fib retracement level of the upward move from the 1.1697 swing low to 1.1807 high. More importantly, there was a break below a major bullish trend line with support near 1.1740 on the hourly chart of EUR/USD.
The pair is now trading below the 1.1750 support level. An initial support is near the 1.1720 level or the 76.4% Fib retracement level of the upward move from the 1.1697 swing low to 1.1807 high.
The next major support is near the 1.1700 zone, below which the pair might accelerate lower towards the 1.1650 and 1.1620 levels. Conversely, the pair might start a fresh increase above the 1.1750 resistance.
The first major resistance is near the 1.1765 level and the 50 hourly simple moving average. A clear break above the 1.1765 level might lead the pair back towards the main 1.1800 resistance level in the coming sessions.
USD/CHF Technical Analysis
After a steady decline, the US Dollar found support near the 0.9130 area against the Swiss franc. The USD/CHF pair traded as low as 0.9133 and recently started a fresh upward move.
There was a break above the 0.9150 resistance level. The pair even broke the 23.6% Fib retracement level of the downward move from the 0.9296 high to 0.9133 low. Moreover, there was a break above a key bearish trend line with resistance near 0.9175 on the hourly chart.
 ur
ur
The pair is now trading nicely above the 0.9180 level and the 50 hourly simple moving average. The next resistance could be near the 0.9200 level.
The first major resistance is near the 0.9215 level since it is close to the 50% Fib retracement level of the downward move from the 0.9296 high to 0.9133 low. A clear break above the 0.9200 resistance and follow up move above 0.9215 might open the doors for more gains in the near term.
The next key resistance is near the 0.9255 level. If there is a downside correction, the pair might find support near the 0.9165 level or the 50 hourly simple moving average.
The next major support is near the 0.9150 level, below which there is a risk of a bearish wave towards the 0.9100 support level.
Trade over 50 forex markets 24 hours a day with FXOpen. Take advantage of low commissions, deep liquidity, and spreads from 0.0 pips (additional fees may apply). Open your FXOpen account now or learn more about trading forex with FXOpen.
This article represents the opinion of the Companies operating under the FXOpen brand only. It is not to be construed as an offer, solicitation, or recommendation with respect to products and services provided by the Companies operating under the FXOpen brand, nor is it to be considered financial advice.
Stay ahead of the market!
Subscribe now to our mailing list and receive the latest market news and insights delivered directly to your inbox.


Latest articles

EUR/USD Eyes Gains As USD/CHF Weakness Deepens Again
EUR/USD started a fresh increase above 1.1700 and 1.1720. USD/CHF declined further and is now struggling below 0.7835.
Important Takeaways for EUR/USD and USD/CHF Analysis Today
· The Euro started a decent increase from

Apple: Earnings Day Above the Activity Zone
On 30 April, after the market close, Apple Inc. will release its financial results for the second quarter of fiscal 2026. The consensus forecast, based on estimates from 31 analysts, points to revenue of around $109.7 billion, with expected

USD/JPY and USD/CHF Near Key Levels: The Dollar Supported by the Fed
The US dollar continues to trend upwards following the Federal Reserve meeting, drawing support from the regulator’s moderately hawkish stance and comments by Jerome Powell. Markets interpret the Fed’s rhetoric as a signal that restrictive policy is likely