


EUR/USD Could Correct Higher While USD/CHF Shows Bearish Signs
FXOpen

EUR/USD started an upside correction from 1.0768, but it is struggling to clear 1.0925. Conversely, USD/CHF is showing a few bearish signs and it could decline below 0.9700.
Important Takeaways for EUR/USD and USD/CHF
- The Euro started a decent upside correction after trading as low as 1.0768 against the US Dollar.
- There was a break above a major bearish trend line with resistance near 1.0825 on the hourly chart of EUR/USD.
- USD/CHF started a downside correction after it failed to clear the 0.9800 resistance area.
- There was a break below a key bullish trend line with support near 0.9770 on the hourly chart.
EUR/USD Technical Analysis
This past week, the Euro remained in a bearish zone below the 1.1000 support against the US Dollar. The EUR/USD pair the 1.0850 support area to move further into a bearish zone.
The pair traded as low as 1.0768 on FXOpen and recently started an upside correction. There was a break above the 1.0800 resistance area and the 50 hourly simple moving average.
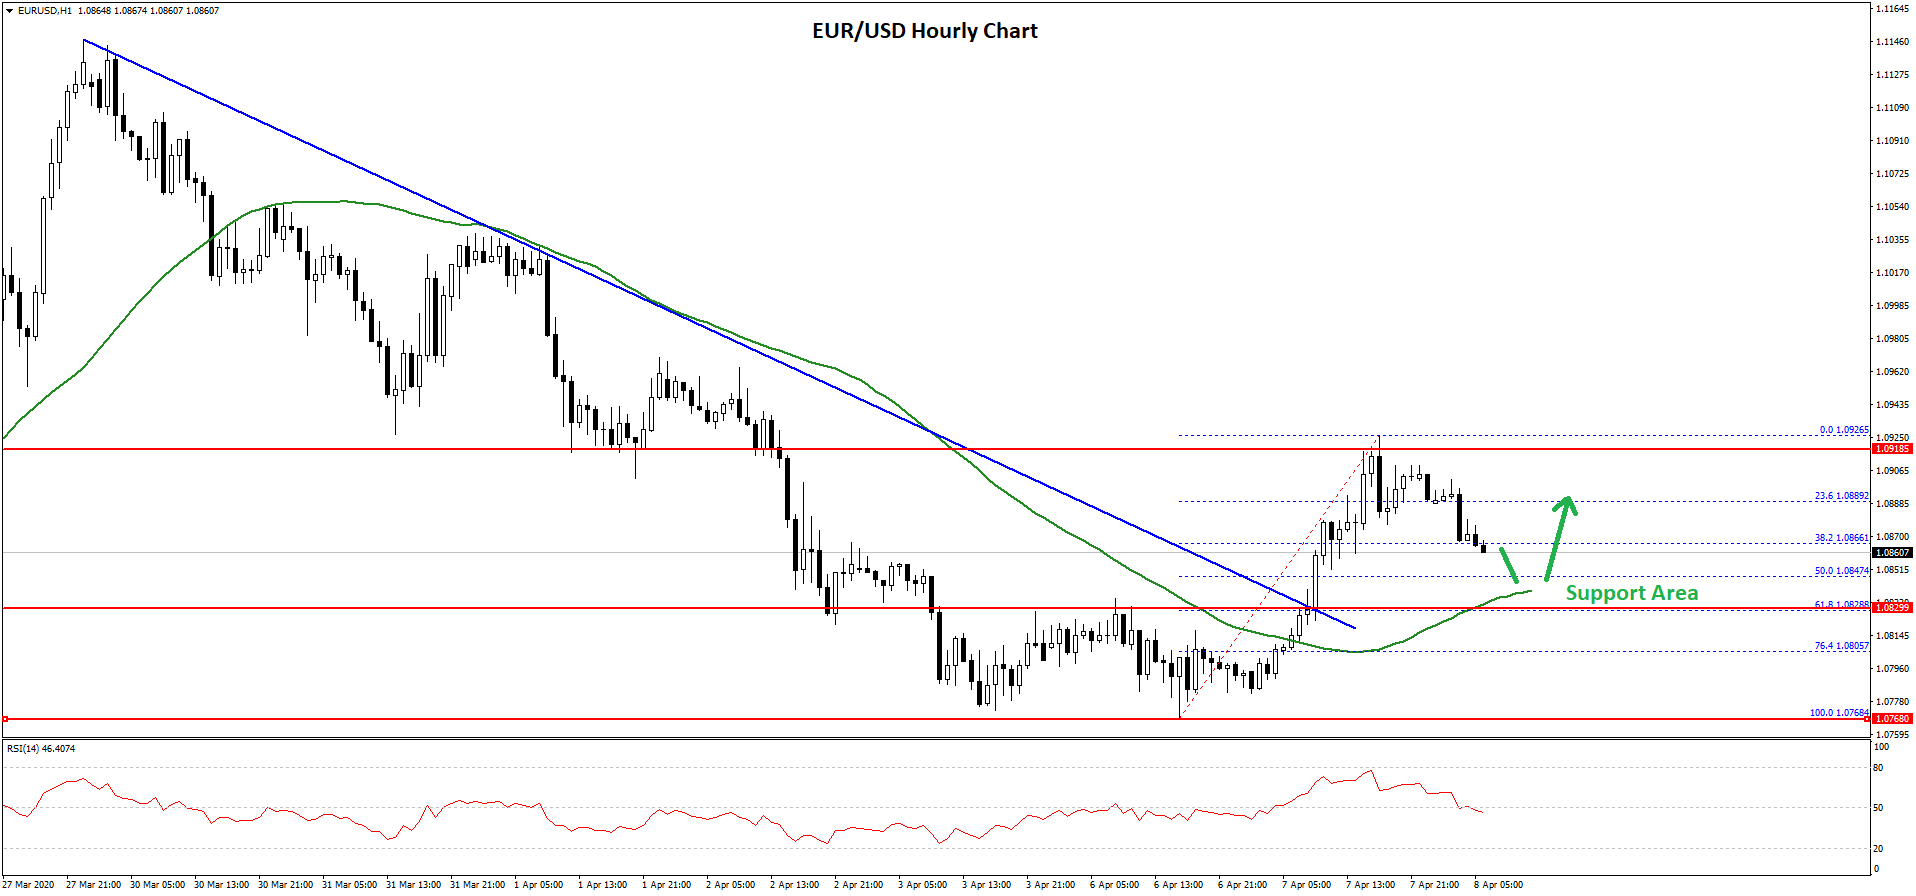
Moreover, there a break above a major bearish trend line with resistance near 1.0825 on the hourly chart of EUR/USD. The pair traded above the 1.0900 level, bit it struggled to continue higher above 1.0925.
It is currently declining and trading below the 1.0900 level. There was a break below the 23.6% Fib retracement level of the recent rise from the 1.0768 low to 1.0926 high.
On the downside, the previous resistance near 1.0850 and the 50 hourly simple moving average might provide support. The 50% Fib retracement level of the recent rise from the 1.0768 low to 1.0926 high is also near the 1.0840 level.
Therefore, EUR/USD could bounce back as long as it is above the 1.0840 support area. On the upside, the bulls need to gain traction above the 1.0900 and 1.0925 levels to start a larger upward move.
Conversely, the pair could resume its decline below the 1.0840 and 1.0800 support levels in the near term.
USD/CHF Technical Analysis
The US Dollar followed a bullish path after it broke the main 0.9650 resistance against the Swiss franc. However, the USD/CHF pair failed to gain momentum above the 0.9800 resistance.
The bulls made a couple of attempts to clear the 0.9800 resistance, but they failed. As a result, there was a bearish reaction from the 0.9796 swing high.
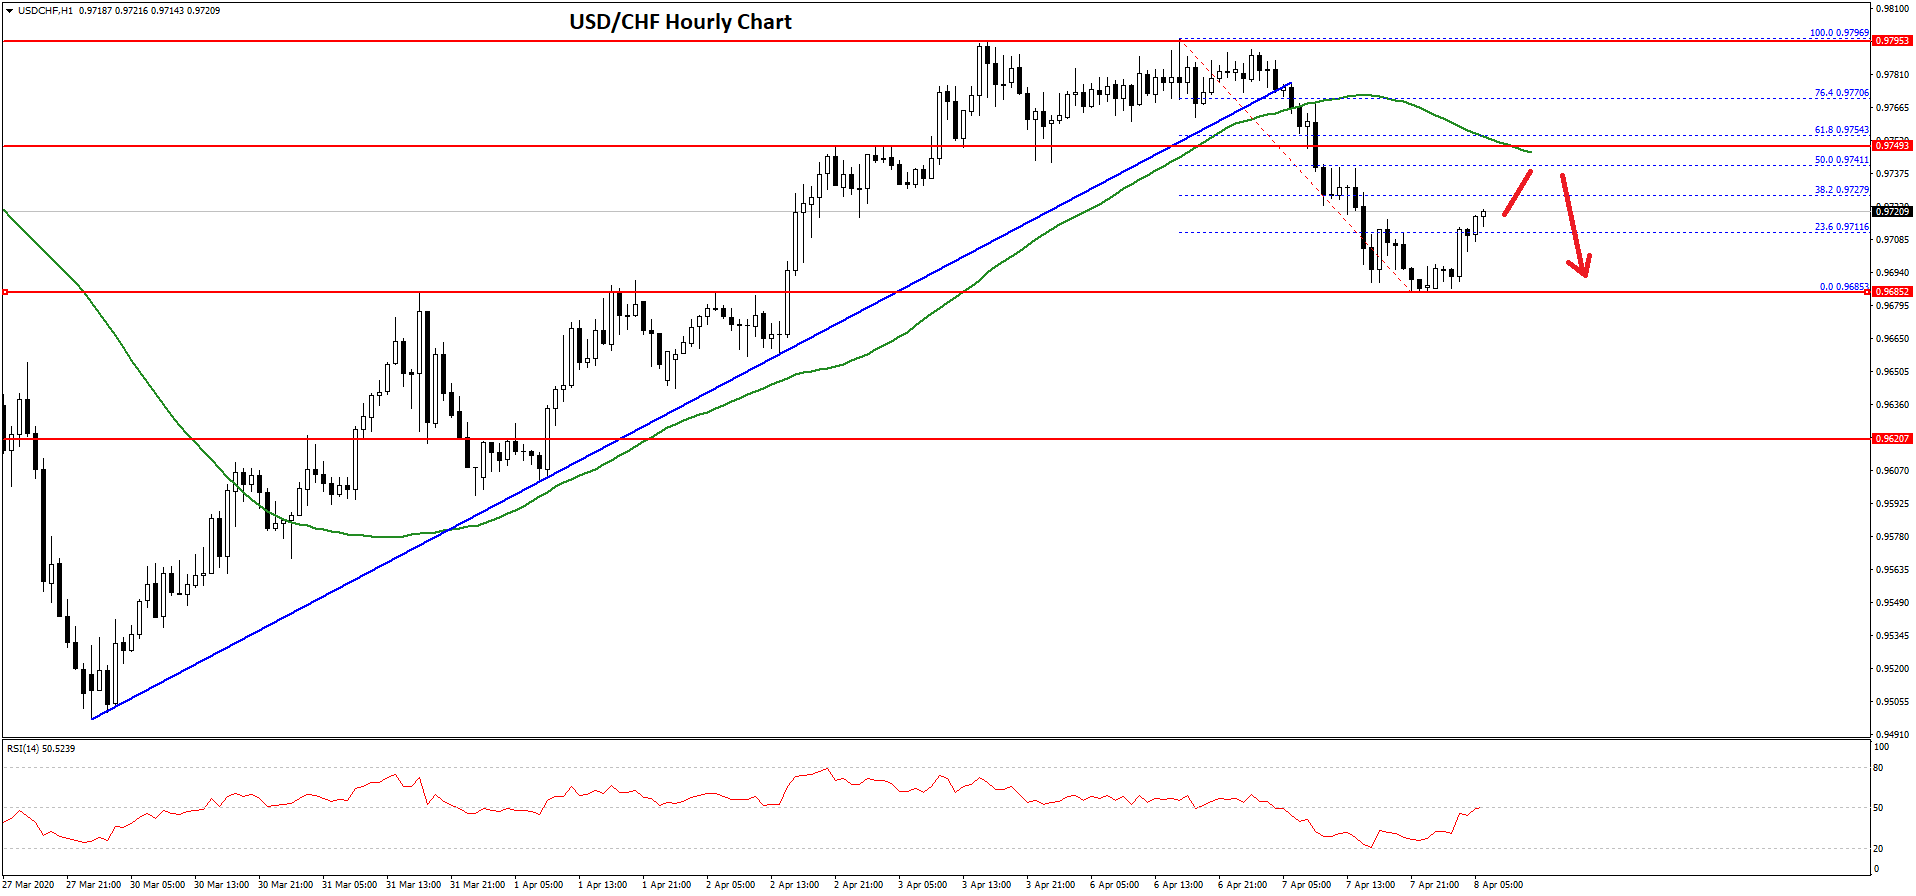
The pair traded below the 0.9750 support level and the 50 hourly simple moving average. Besides, there was a break below a key bullish trend line with support near 0.9770 on the hourly chart.
The pair even spiked below 0.9700 before the bulls appeared near 0.9680. A low is formed near 0.9685 and the pair is currently correcting higher. It is trading above the 23.6% Fib retracement level of the recent decline from the 0.9796 high to 0.9685 low.
On the upside, there is a major resistance forming near the 0.9740 level and the 50 hourly simple moving average. The 50% Fib retracement level of the recent decline from the 0.9796 high to 0.9685 low is also near the 0.9740 level.
The pair is likely to struggle near 0.9740 and it could resume its decline. On the downside, the main supports are 0.9700 and 0.9680, below which USD/CHF might slide towards 0.9600.
Trade over 50 forex markets 24 hours a day with FXOpen. Take advantage of low commissions, deep liquidity, and spreads from 0.0 pips (additional fees may apply). Open your FXOpen account now or learn more about trading forex with FXOpen.
This article represents the opinion of the Companies operating under the FXOpen brand only. It is not to be construed as an offer, solicitation, or recommendation with respect to products and services provided by the Companies operating under the FXOpen brand, nor is it to be considered financial advice.
Stay ahead of the market!
Subscribe now to our mailing list and receive the latest market news and insights delivered directly to your inbox.


Latest articles

EUR/USD Eyes Gains As USD/CHF Weakness Deepens Again
EUR/USD started a fresh increase above 1.1700 and 1.1720. USD/CHF declined further and is now struggling below 0.7835.
Important Takeaways for EUR/USD and USD/CHF Analysis Today
· The Euro started a decent increase from

Apple: Earnings Day Above the Activity Zone
On 30 April, after the market close, Apple Inc. will release its financial results for the second quarter of fiscal 2026. The consensus forecast, based on estimates from 31 analysts, points to revenue of around $109.7 billion, with expected

USD/JPY and USD/CHF Near Key Levels: The Dollar Supported by the Fed
The US dollar continues to trend upwards following the Federal Reserve meeting, drawing support from the regulator’s moderately hawkish stance and comments by Jerome Powell. Markets interpret the Fed’s rhetoric as a signal that restrictive policy is likely