EUR/USD Dives Again, USD/JPY Breaking Down
EUR/USD topped near the 1.1175 level and started a fresh decline below 1.1120. USD/JPY is also showing bearish signs and it could continue to move down towards 108.70.
Important Takeaways for EUR/USD and USD/JPY
- The Euro started a fresh decline after it failed to clear the 1.1175 resistance area.
- There was a break below a key bullish trend line with support near 1.1115 on the hourly chart of EUR/USD.
- USD/JPY is showing a few bearish signs below the 109.25 resistance area.
- The pair is struggling to stay above a major bullish trend line with support near 109.00 on the hourly chart.
EUR/USD Technical Analysis
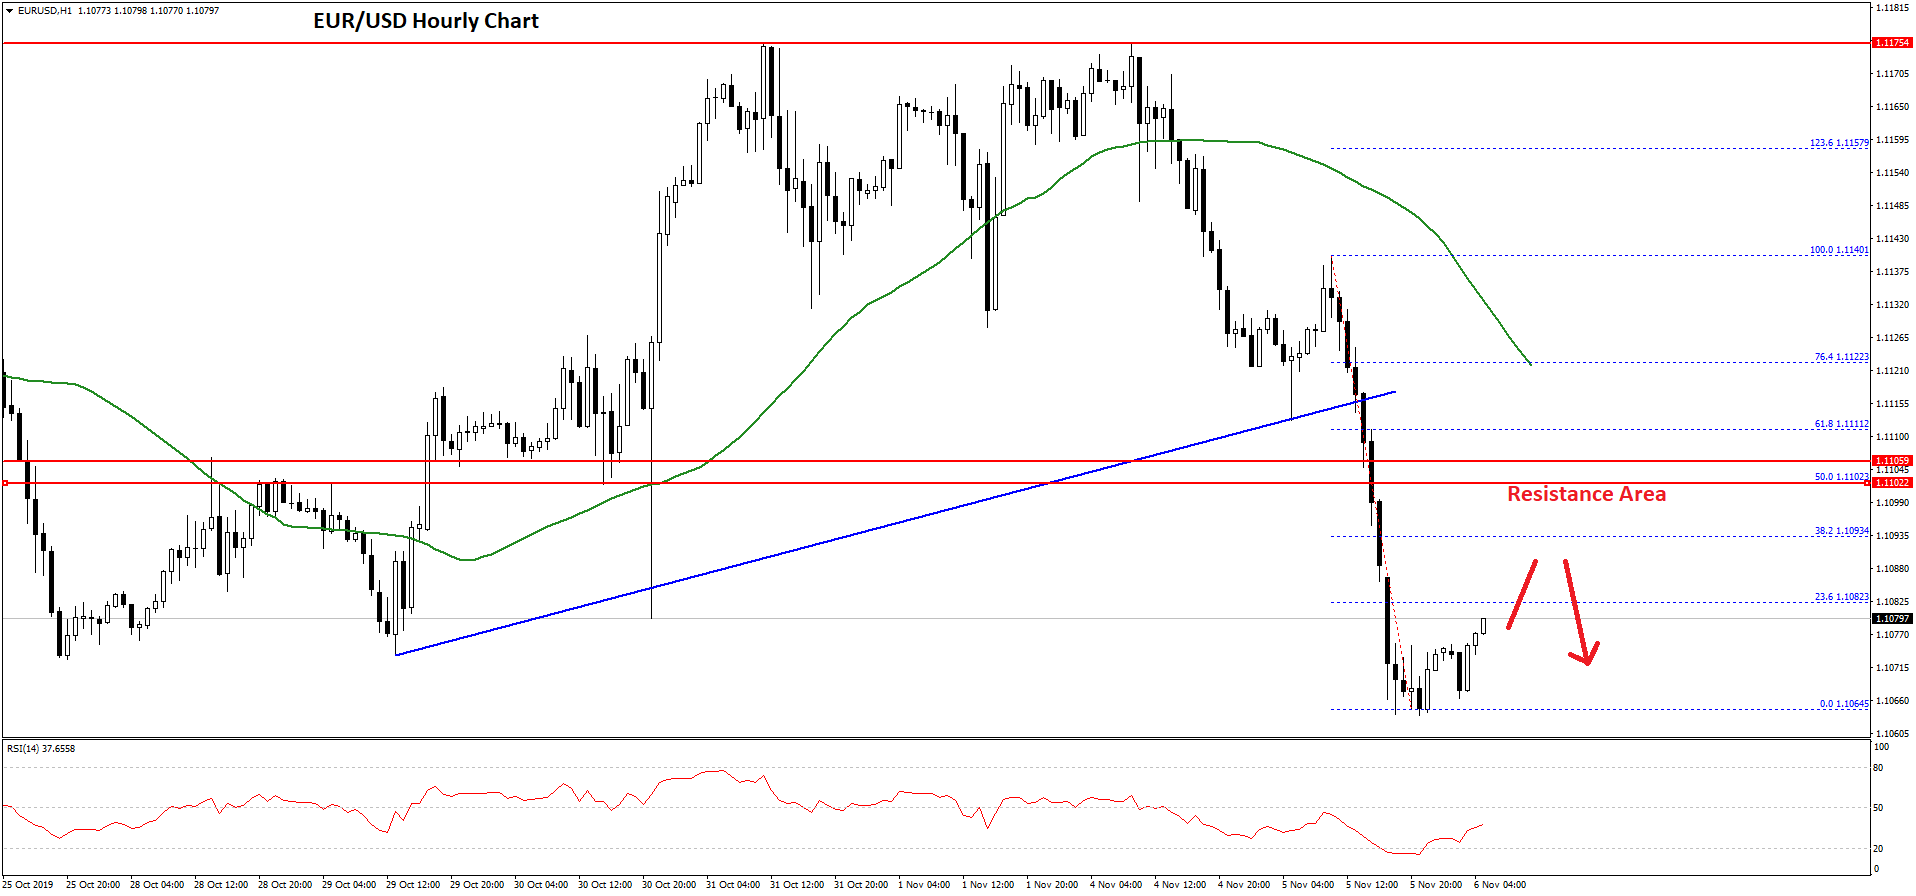
The Euro made a few attempts to break the 1.1175 and 1.1180 resistance levels against the US Dollar. However, the EUR/USD pair failed to continue above 1.11750, resulting in a bearish reaction.
There was a sharp decline below the 1.1150 support area and the 50 hourly simple moving average. It opened the doors for more losses below the 1.1120 and 1.1100 support levels.
Moreover, there was a break below a key bullish trend line with support near 1.1115 on the hourly chart of EUR/USD. The pair even traded below the 1.1080 support area and formed a low near 1.1064 on FXOpen.
It is currently consolidating losses above the 1.1065 support area. On the upside, an initial resistance is near the 1.1080 level. It represents the 23.6% Fib retracement level of the recent decline from the 1.1140 high to 1.1064 low.
On the upside, the main resistance for the bulls is near the 1.1100 area. It also coincides with the 50% Fib retracement level of the recent decline from the 1.1140 high to 1.1064 low.
On the downside, an initial support is near the 1.1065 level. If there are more downsides, EUR/USD could continue to move down towards the 1.1040 and 1.1025 support levels in the coming sessions.
USD/JPY Technical Analysis
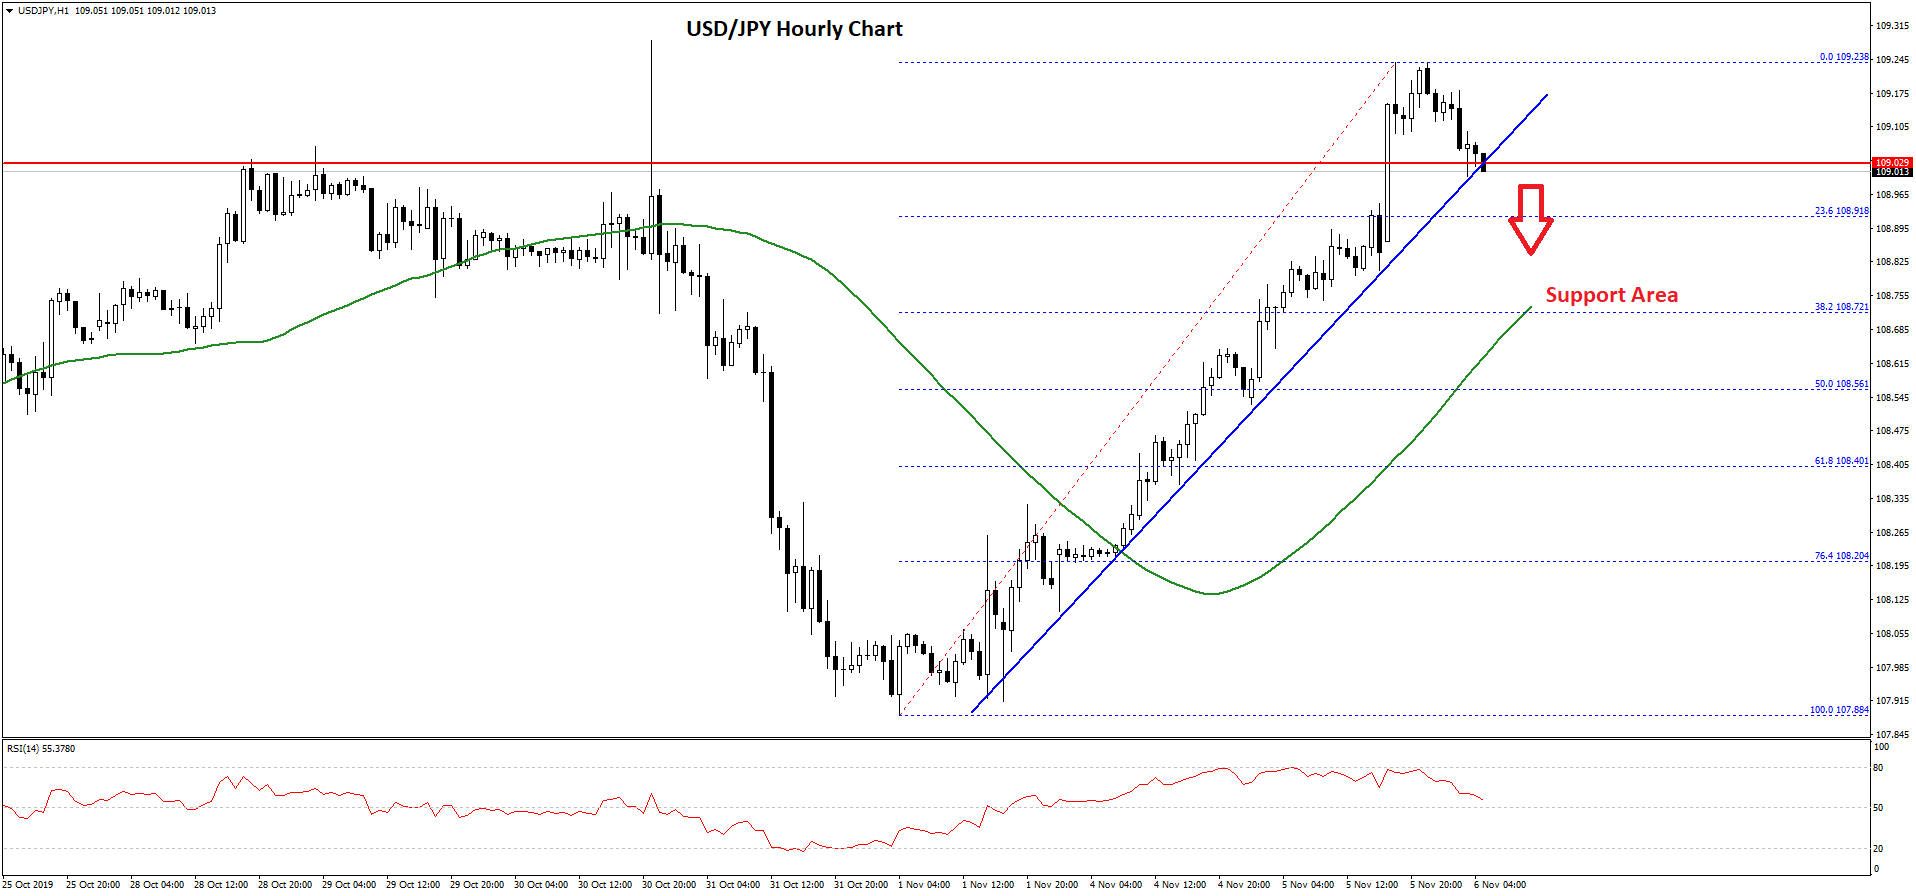
The US Dollar remained in a positive zone above the 108.00 and 108.20 support levels against the Japanese Yen. As a result, the USD/JPY pair climbed above the 108.50 resistance area.
The pair even broke the 109.00 resistance area and the 50 hourly simple moving average. However, the pair seems to be facing a strong resistance near the 109.25 area.
It is currently correcting lower below 109.10. More importantly, the pair is struggling to stay above a major bullish trend line with support near 109.00 on the hourly chart.
If there is a downside break, the pair could test the 108.70 support are and the 50 hourly simple moving average. It also coincides with the 38.2% Fib retracement level of the upward move from the 107.88 low to 109.23 high.
If there are more downsides, the next stop could be near the 108.55 level. It coincides with the 50% Fib retracement level of the upward move from the 107.88 low to 109.23 high.
On the upside, the main resistance is near the 109.25 level. If there is a clear break above the 109.25 level, there are chances of more gains above the 109.40 and 109.50 levels.
Overall, USD/JPY is showing a few bearish signs and there is a risk of more downsides below the 109.00 and 108.80 levels in the near term.