


EUR/USD Extending Decline While USD/JPY Could Grind Higher
FXOpen

EUR/USD is under pressure and it recently broke the 1.1120 support area. USD/JPY is showing positive signs and it seems like there could be more upsides above 106.00.
Important Takeaways for EUR/USD and USD/JPY
- The Euro failed to break the 1.1150 resistance and declined recently below the 1.1120 support.
- There is a major declining channel forming with resistance near 1.1105 on the hourly chart of EUR/USD.
- USD/JPY is showing positive signs and is trading nicely above the 105.60 support area.
- There is a key bearish trend line forming with resistance near 105.90 on the hourly chart.
EUR/USD Technical Analysis
This past week, the Euro recovered above the 1.1120 and 1.1140 levels against the US Dollar. However, the EUR/USD pair failed to gain traction above the 1.1150 and 1.1160 levels. As a result, a fresh bearish wave was initiated below the 1.1140 level.
A swing high was formed near 1.1163 on FXOpen and the pair broke the key 1.1120 support level to move into a bearish zone. Moreover, there was a close below 1.1100 and the 50 hourly simple moving average.
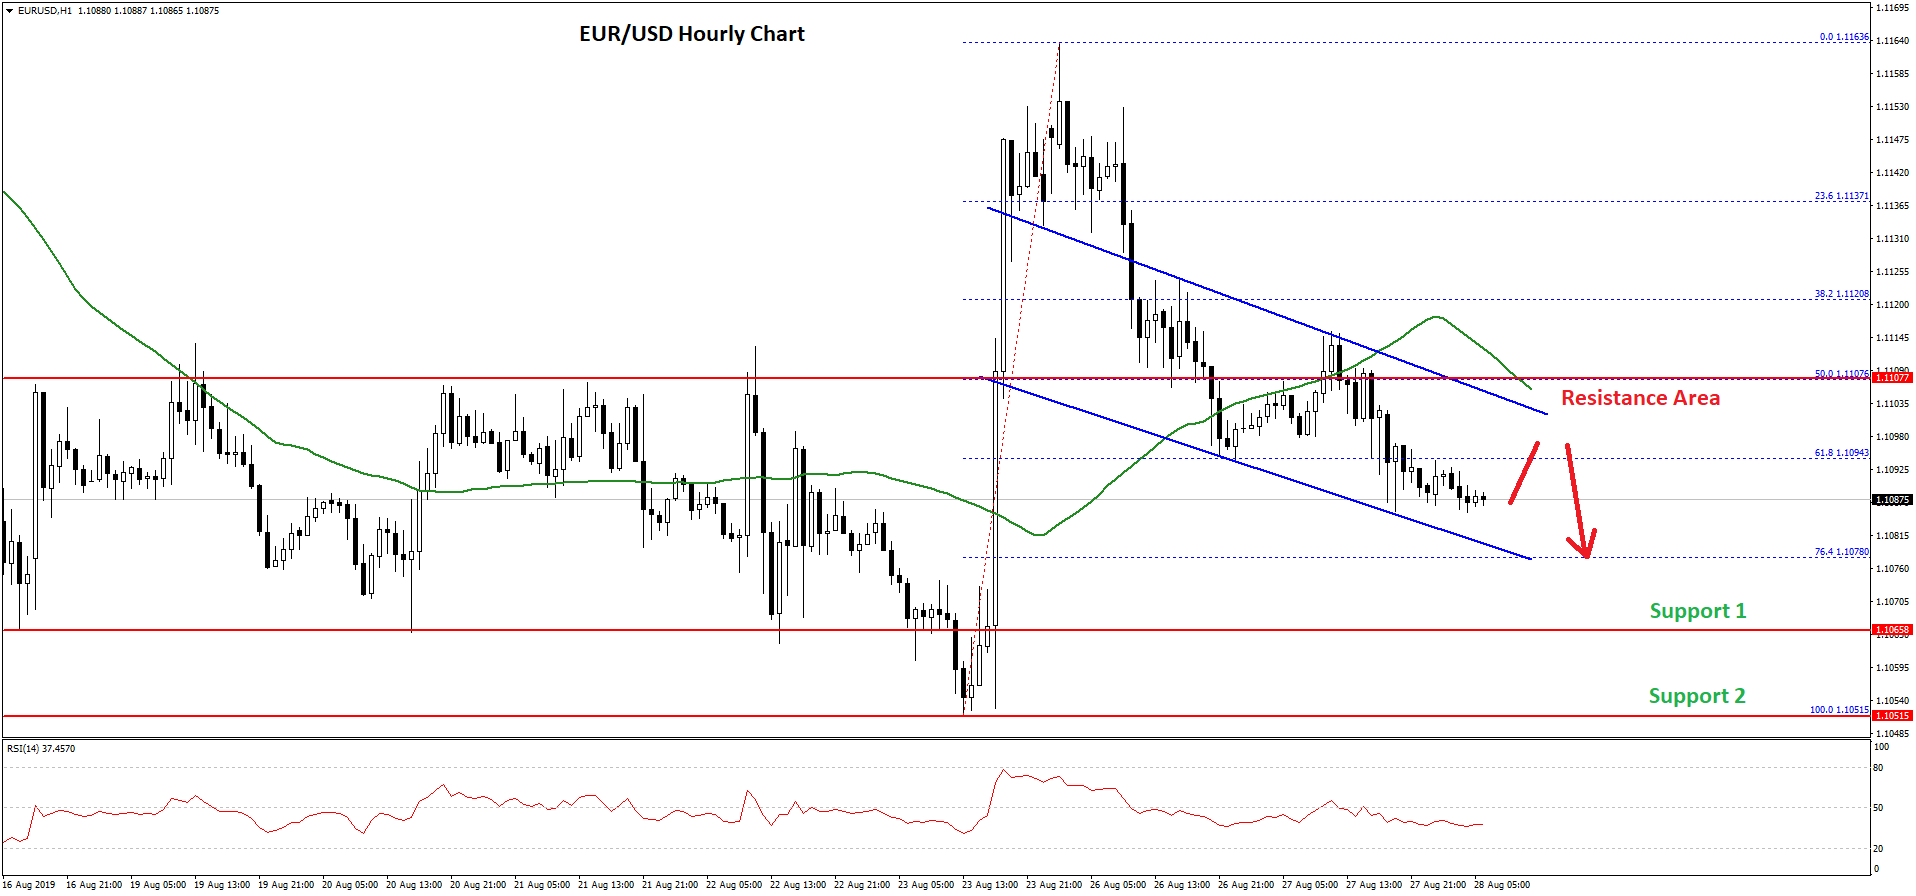
Moreover, there was a break below the 50% Fib retracement level of the upward move from the 1.1050 swing low to 1.1163 high. The price is now trading well below 1.1100 and the 50 hourly SMA.
There is also a major declining channel forming with resistance near 1.1105 on the hourly chart of EUR/USD. The pair needs to break the 1.1100 resistance, the channel resistance, and the 50 hourly simple moving average to start a decent recovery.
The next key resistance is near the 1.1120 level, above which the pair could trade towards the 1.1150 level. Conversely, the pair might continue to move down below 1.1085. An immediate support is near the 76.4% Fib retracement level of the upward move from the 1.1050 swing low to 1.1163 high.
If EUR/USD breaks the 1.1080 support, it could revisit the main 1.1050 support area in the coming sessions.
USD/JPY Technical Analysis
This past week, there was a sharp decline in the US Dollar below the 106.00 support against the Japanese Yen. The USD/JPY pair even broke the 105.20 support level and traded below 105.00.
It traded towards 104.50 and a swing low was formed near 104.45. Recently, the pair started a strong recovery and climbed above the 105.00 and 105.40 resistance levels. Moreover, there was a break above the 106.00 level and the 50 hourly simple moving average.
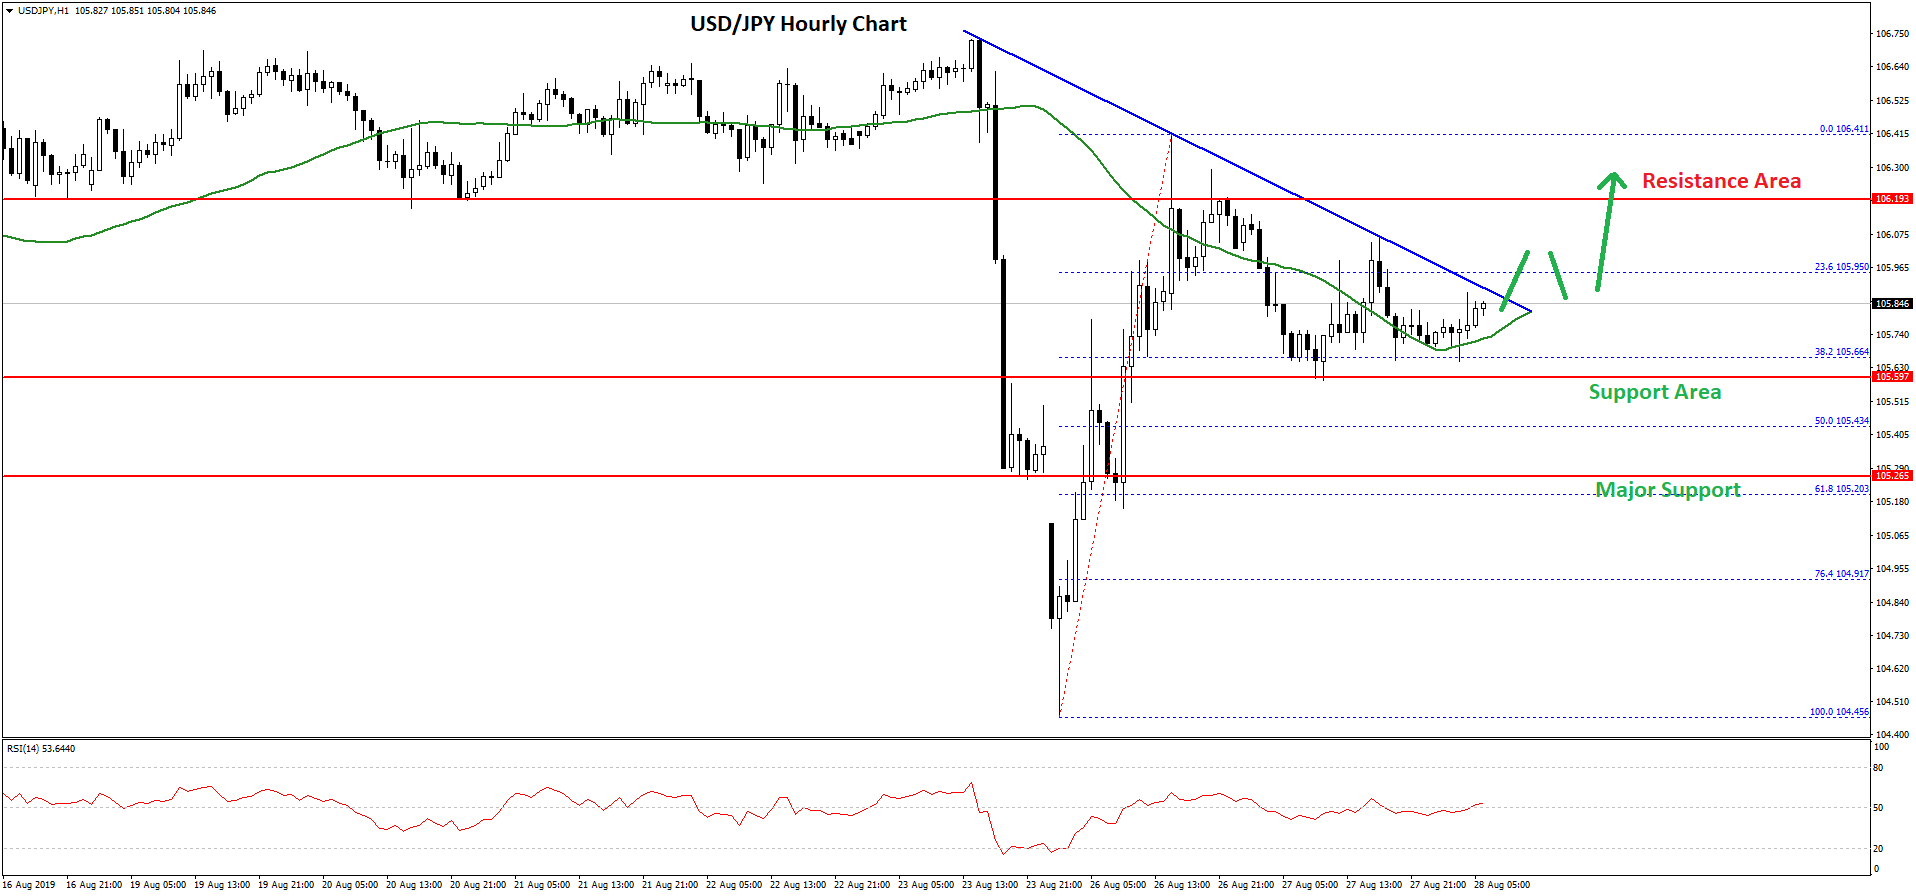
However, the pair struggled to break the 106.40 level and recently corrected lower below 106.00 plus the 23.6% Fib retracement level of the last wave from the 104.45 low to 106.40 high.
At the moment, the 105.60 level is acting as a support and the pair is showing positive signs. On the upside, there is a key bearish trend line forming with resistance near 105.90 on the hourly chart.
If there is an upside break above 105.90 and 106.00, the pair could continue to move higher. The next key resistance is near the 106.20 and 106.40 levels.
Conversely, if the pair fails to climb above 106.00, it could trim gains. The main support on the downside is near the 105.40 level. It represents the 50% Fib retracement level of the last wave from the 104.45 low to 106.40 high. Moreover, the 105.25 level is also a crucial support zone.
Trade over 50 forex markets 24 hours a day with FXOpen. Take advantage of low commissions, deep liquidity, and spreads from 0.0 pips (additional fees may apply). Open your FXOpen account now or learn more about trading forex with FXOpen.
This article represents the opinion of the Companies operating under the FXOpen brand only. It is not to be construed as an offer, solicitation, or recommendation with respect to products and services provided by the Companies operating under the FXOpen brand, nor is it to be considered financial advice.
Stay ahead of the market!
Subscribe now to our mailing list and receive the latest market news and insights delivered directly to your inbox.


Latest articles

EUR/USD Eyes Gains As USD/CHF Weakness Deepens Again
EUR/USD started a fresh increase above 1.1700 and 1.1720. USD/CHF declined further and is now struggling below 0.7835.
Important Takeaways for EUR/USD and USD/CHF Analysis Today
· The Euro started a decent increase from

Apple: Earnings Day Above the Activity Zone
On 30 April, after the market close, Apple Inc. will release its financial results for the second quarter of fiscal 2026. The consensus forecast, based on estimates from 31 analysts, points to revenue of around $109.7 billion, with expected

USD/JPY and USD/CHF Near Key Levels: The Dollar Supported by the Fed
The US dollar continues to trend upwards following the Federal Reserve meeting, drawing support from the regulator’s moderately hawkish stance and comments by Jerome Powell. Markets interpret the Fed’s rhetoric as a signal that restrictive policy is likely