


EUR/USD Facing Hurdles While USD/JPY Remains in Uptrend
FXOpen
EUR/USD declined recently, found support near 1.1530, and later recovered. USD/JPY broke key resistances and is currently placed nicely above the 111.20 support area.
Important Takeaways for EUR/USD and USD/JPY
- The Euro declined heavily recently after it failed to stay above the 1.1650 support.
- EUR/USD is recovering, but it is facing a major bearish trend line with resistance at 1.1600 on the hourly chart.
- USD/JPY is placed nicely in an uptrend above the 111.20 support and the 50 hourly simple moving average.
- There is a crucial bullish trend line in place with support at 111.35 on the hourly chart.
EUR/USD Technical Analysis
The Euro started a downside move from well above the 1.1700 level against the US Dollar. The EUR/USD pair declined and broke many support levels like 1.1680, 1.1650, 1.1600 and 1.1550.
The pair traded as low as 1.1530 and later started an upward move. It recovered above the 23.6% Fib retracement level of the last drop from the 1.1688 high to 1.1530 low. There was also a break above the 1.1580 level and the 50 hourly simple moving average.
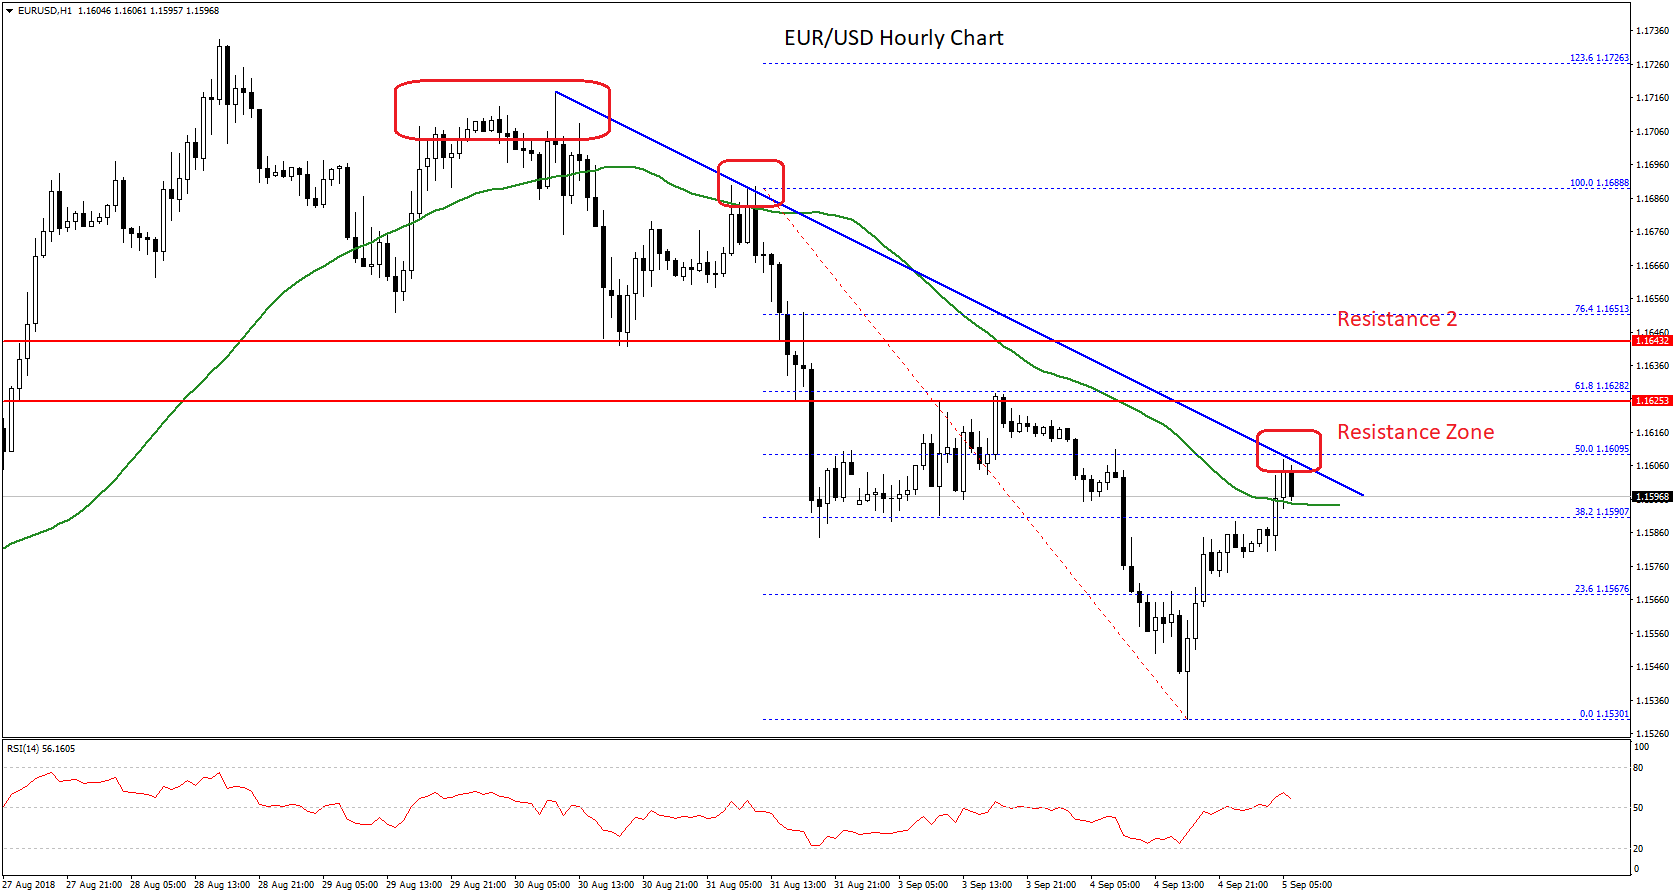
However, the pair faced a strong resistance near the 1.1600-1.1610 zone. It seems like the 50% Fib retracement level of the last drop from the 1.1688 high to 1.1530 low is acting as a key hurdle for buyers.
More importantly, there is a major bearish trend line in place with resistance at 1.1600 on the hourly chart. Above the trend line resistance, the pair could face a solid resistance near the 1.1630 zone, which was a support earlier.
If the pair fails to move above the 1.1600 and 1.1630 resistance levels, it could resume it slide in the short term. On the downside, an initial support is 1.1580, below which EUR/USD could accelerate losses towards the 1.1550 and 1.1530 levels.
USD/JPY Technical Analysis
The US Dollar found a strong buying interest near the 110.70 zone against the Japanese Yen. The USD/JPY pair started a solid upward move and traded above the 111.00 and 111.20 resistance levels.
The upward move was positive as the pair climbed above the 111.50 level and also settled above the 50 hourly simple moving average. During the rise, there was a break above a major bearish trend line with resistance at 111.15 on the hourly chart.
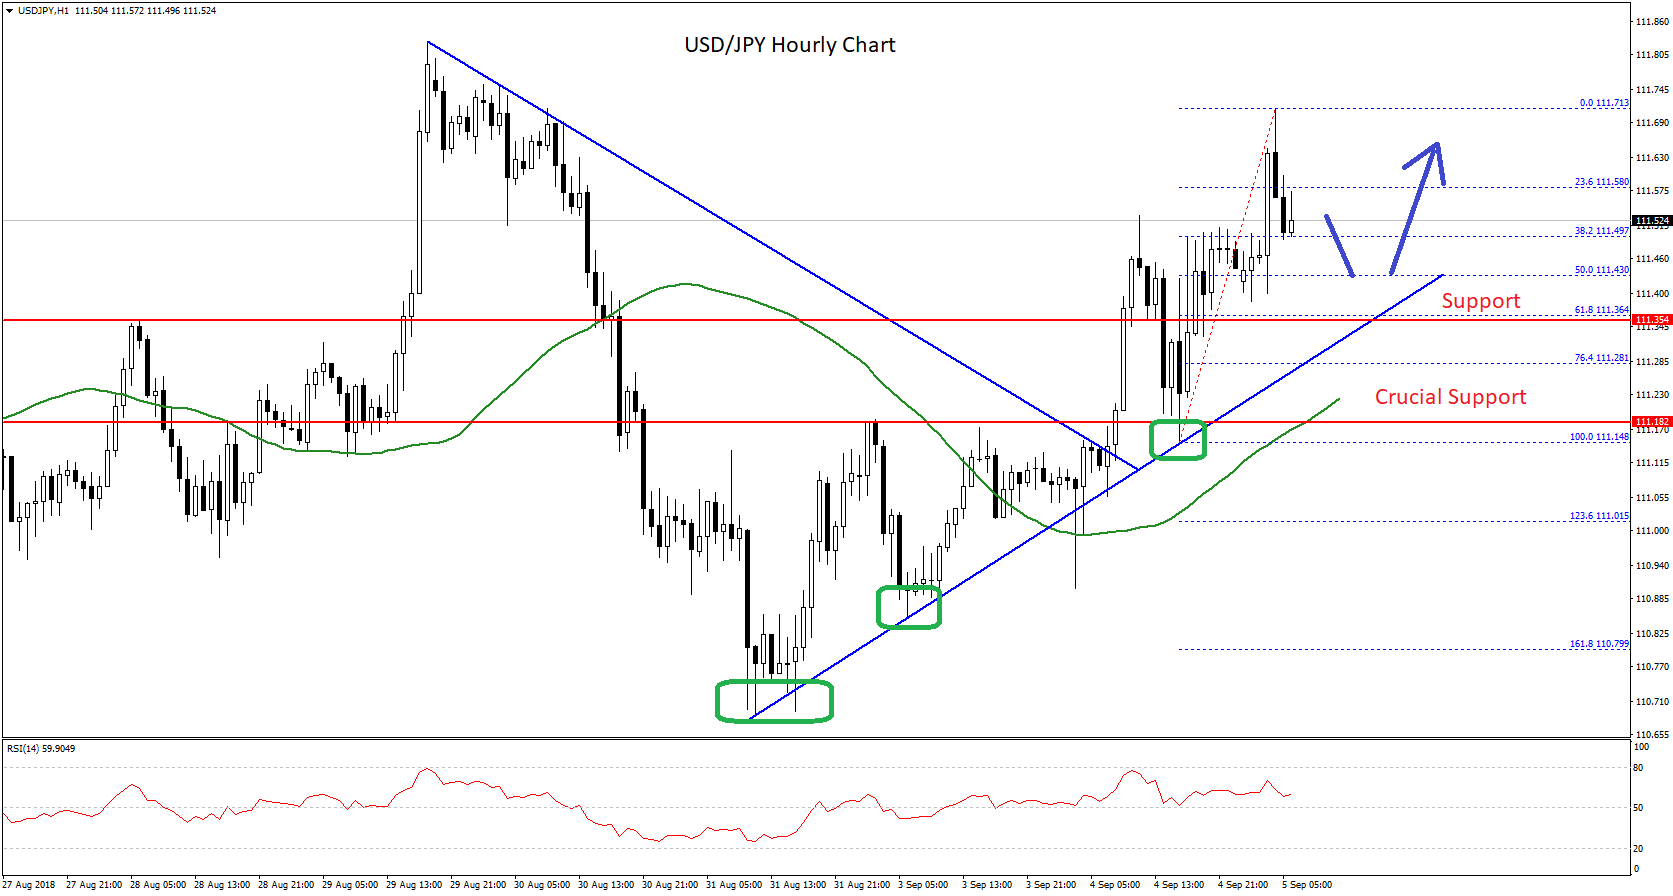
The recent high was formed at 111.71 and the pair is currently correcting lower. It has breached the 23.6% Fib retracement level of the last wave from the 111.14 low to 111.71 high.
However, there are many supports on the downside near the 111.20 and 111.30 levels. An initial support is the 50% Fib retracement level of the last wave from the 111.14 low to 111.71 high at 111.43. Below this, there is a crucial bullish trend line in place with support at 111.35 on the hourly chart.
Below the trend line support, the most important buy zone is near the 111.20 level and the 50 hourly SMA. The stated 111.20 zone was a resistance earlier, and now it is likely to act as a strong support if the pair dips further.
On the upside, an initial resistance is near the 111.71 high, above which the USD/JPY pair is likely to break the 112.00 resistance for more gains in the near term.
Trade over 50 forex markets 24 hours a day with FXOpen. Take advantage of low commissions, deep liquidity, and spreads from 0.0 pips (additional fees may apply). Open your FXOpen account now or learn more about trading forex with FXOpen.
This article represents the opinion of the Companies operating under the FXOpen brand only. It is not to be construed as an offer, solicitation, or recommendation with respect to products and services provided by the Companies operating under the FXOpen brand, nor is it to be considered financial advice.
Stay ahead of the market!
Subscribe now to our mailing list and receive the latest market news and insights delivered directly to your inbox.


Latest articles

DAX 40: consolidation amid technology sell-off
A wave of selling in the technology sector that emerged earlier this week has weighed on European equities. The trigger was investor concern over the profitability of large-scale debt-funded investments by major US tech companies in AI infrastructure. The Nasdaq

Euro Hits Fresh Yearly Lows Amid Dovish ECB Signals
The euro remains under pressure following weak macroeconomic data from the euro area and fresh signals that the European Central Bank is prepared to maintain a more accommodative monetary policy stance. Data released yesterday pointed to a deterioration in business

Pound at Key Levels: Markets Assess Impact of Political Uncertainty in the UK
The British pound remains under pressure following increased political uncertainty in the United Kingdom triggered by the Prime Minister’s resignation. Investors are assessing potential shifts in the political and economic policy outlook after the head of government stepped down,