


FXOpen

EUR/USD gained pace for a move above the 1.0700 resistance. USD/JPY is also rising and might rally further above the 132.60 resistance.
Important Takeaways for EUR/USD and USD/JPY
· The Euro started a fresh increase above the 1.0700 resistance zone.
· There is a key bullish trend line forming with support near 1.0740 on the hourly chart of EUR/USD.
· USD/JPY is showing a lot of bullish signs above the 131.80 support zone.
· There was a break above a major bearish trend line with resistance near 131.50 on the hourly chart.
EUR/USD Technical Analysis
This past week, the Euro found support near the 1.0530 zone against the US Dollar. The EUR/USD pair formed a base and recently started a steady increase.
There was a clear move above the 1.0620 and 1.0650 resistance levels. The pair even climbed above the 1.0700 level and the 50 hourly simple moving average. Finally, the pair tested the 1.0780 zone and traded as high as 1.0788 on FXOpen.
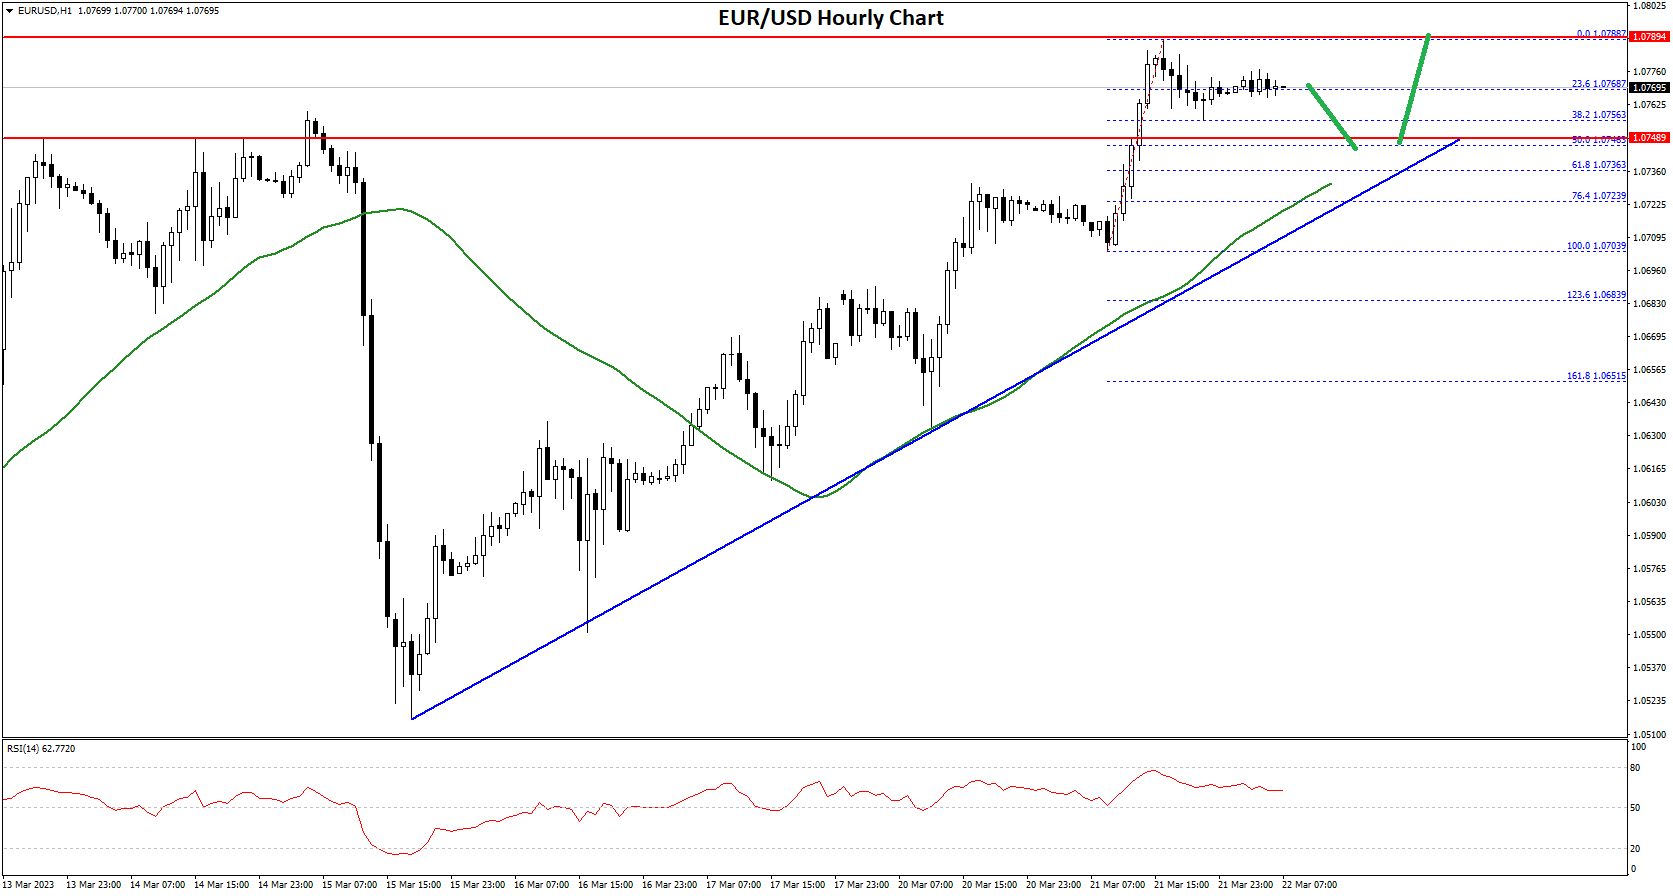
It is now consolidating gains below the 1.0780 level. An initial support on the downside is near the 1.0755 level. It is near the 38.2% Fib retracement level of the upward move from the 1.0703 swing low to 1.0788 high.
The first major support is near the 1.0740 level. There is also a key bullish trend line forming with support near 1.0740 on the hourly chart of EUR/USD.
The trend line is near the 50% Fib retracement level of the upward move from the 1.0703 swing low to 1.0788 high. The main support sits near the 1.0725 zone, below which the pair could start a major decline. In the stated case, the pair might dive towards the 1.0650 support zone.
On the upside, an immediate resistance is near the 1.0780 level. The next major resistance is near the 1.0800 level. An upside break above 1.0800 could set the pace for another increase. In the stated case, the pair might visit 1.0880. Any more gains might send the pair towards 1.0950.
USD/JPY Technical Analysis
The US Dollar started a fresh increase from the 130.50 zone against the Japanese Yen. The USD/JPY pair started a decent increase above the 131.20 resistance zone.
There was a break above a major bearish trend line with resistance near 131.50 on the hourly chart. The pair even cleared the 132.00 resistance. There was a move above the 50% Fib retracement level of the downward move from the 133.85 swing high to 130.53 low.
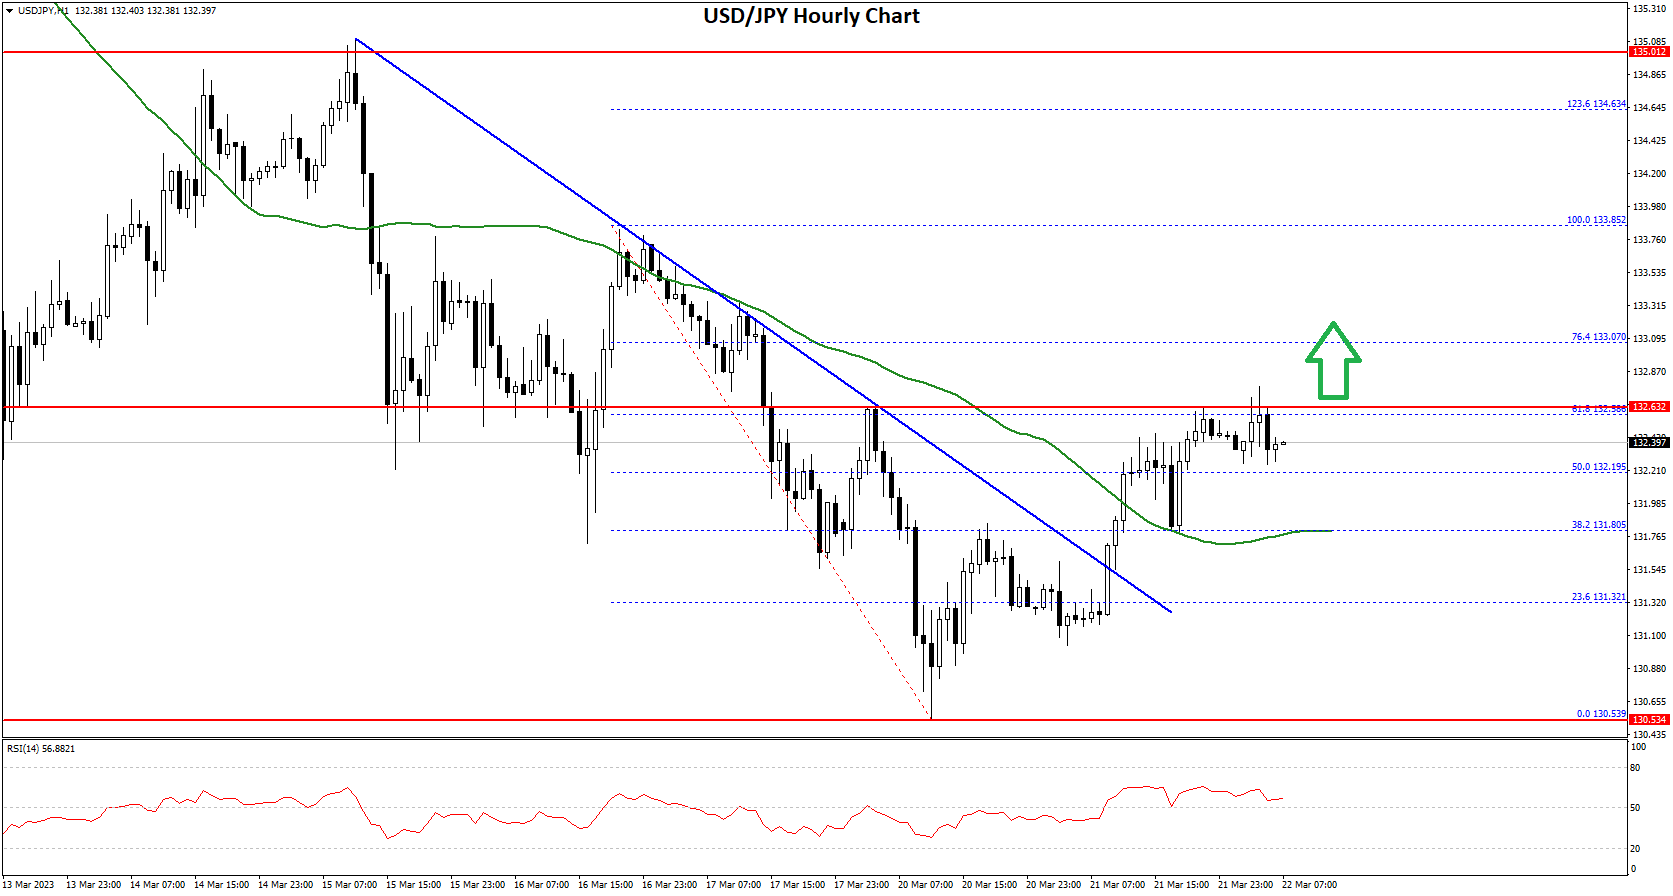
On the upside, the pair is facing resistance near the 132.60 zone. It is near the 61.8% Fib retracement level of the downward move from the 133.85 swing high to 130.53 low.
A clear move above the 132.60 resistance might start a strong increase. The next major resistance is near 133.80, above which the pair could test 134.50.
An initial support on the downside is near the 132.00 level. The first major support is near the 131.80 level or the 50 hourly simple moving average, below which the pair could start a major decline.
In the stated case, the pair might dive towards the 130.50 support zone. Any more losses might send the USD/JPY pair towards the 130.00 support zone.
This forecast represents FXOpen Companies opinion only, it should not be construed as an offer, invitation or recommendation in respect to FXOpen Companies products and services or as financial advice.
Trade over 50 forex markets 24 hours a day with FXOpen. Take advantage of low commissions, deep liquidity, and spreads from 0.0 pips (additional fees may apply). Open your FXOpen account now or learn more about trading forex with FXOpen.
This article represents the opinion of the Companies operating under the FXOpen brand only. It is not to be construed as an offer, solicitation, or recommendation with respect to products and services provided by the Companies operating under the FXOpen brand, nor is it to be considered financial advice.
Stay ahead of the market!
Subscribe now to our mailing list and receive the latest market news and insights delivered directly to your inbox.


Latest articles

Consolidation Ahead of NFP: Commodity Currencies Search for Direction
Commodity-linked currencies have entered a consolidation phase following recent directional moves, as market participants adopt a wait-and-see approach ahead of key US labour market data. Current price action reflects a balance between ongoing demand for the US dollar and attempts

The Real Driver Behind the Dollar Rally: Market Insights with Gary Thomson
The US dollar has been firm, but the drivers behind the move may be more complex than they first appear.
While geopolitical tension and shifts in risk sentiment play a role, current price behaviour seems increasingly influenced by inflation expectations

EUR/USD and USD/CHF Pull Back: Market Reacts to Fundamentals
European currencies have shown a recovery in recent trading sessions after their recent decline, displaying early signs of a reversal. The US dollar is weakening amid expectations surrounding upcoming US macroeconomic data, while market participants are reassessing their short-term positions