EUR/USD is Facing Hurdles, USD/JPY Remains Elevated
EUR/USD failed to stay above the 1.2100 zone and corrected lower. USD/JPY is trading in a positive zone above 109.00 and it is now approaching a major breakout.
Important Takeaways for EUR/USD and USD/JPY
- The Euro started a fresh decline from well above the 1.2100 pivot level.
- There is a key bearish trend line forming with resistance near 1.2040 on the hourly chart of EUR/USD.
- USD/JPY started a decent increase above the 108.50 and 109.00 resistance levels.
- There is a major breakout pattern forming with resistance near 109.38 on the hourly chart.
EUR/USD Technical Analysis
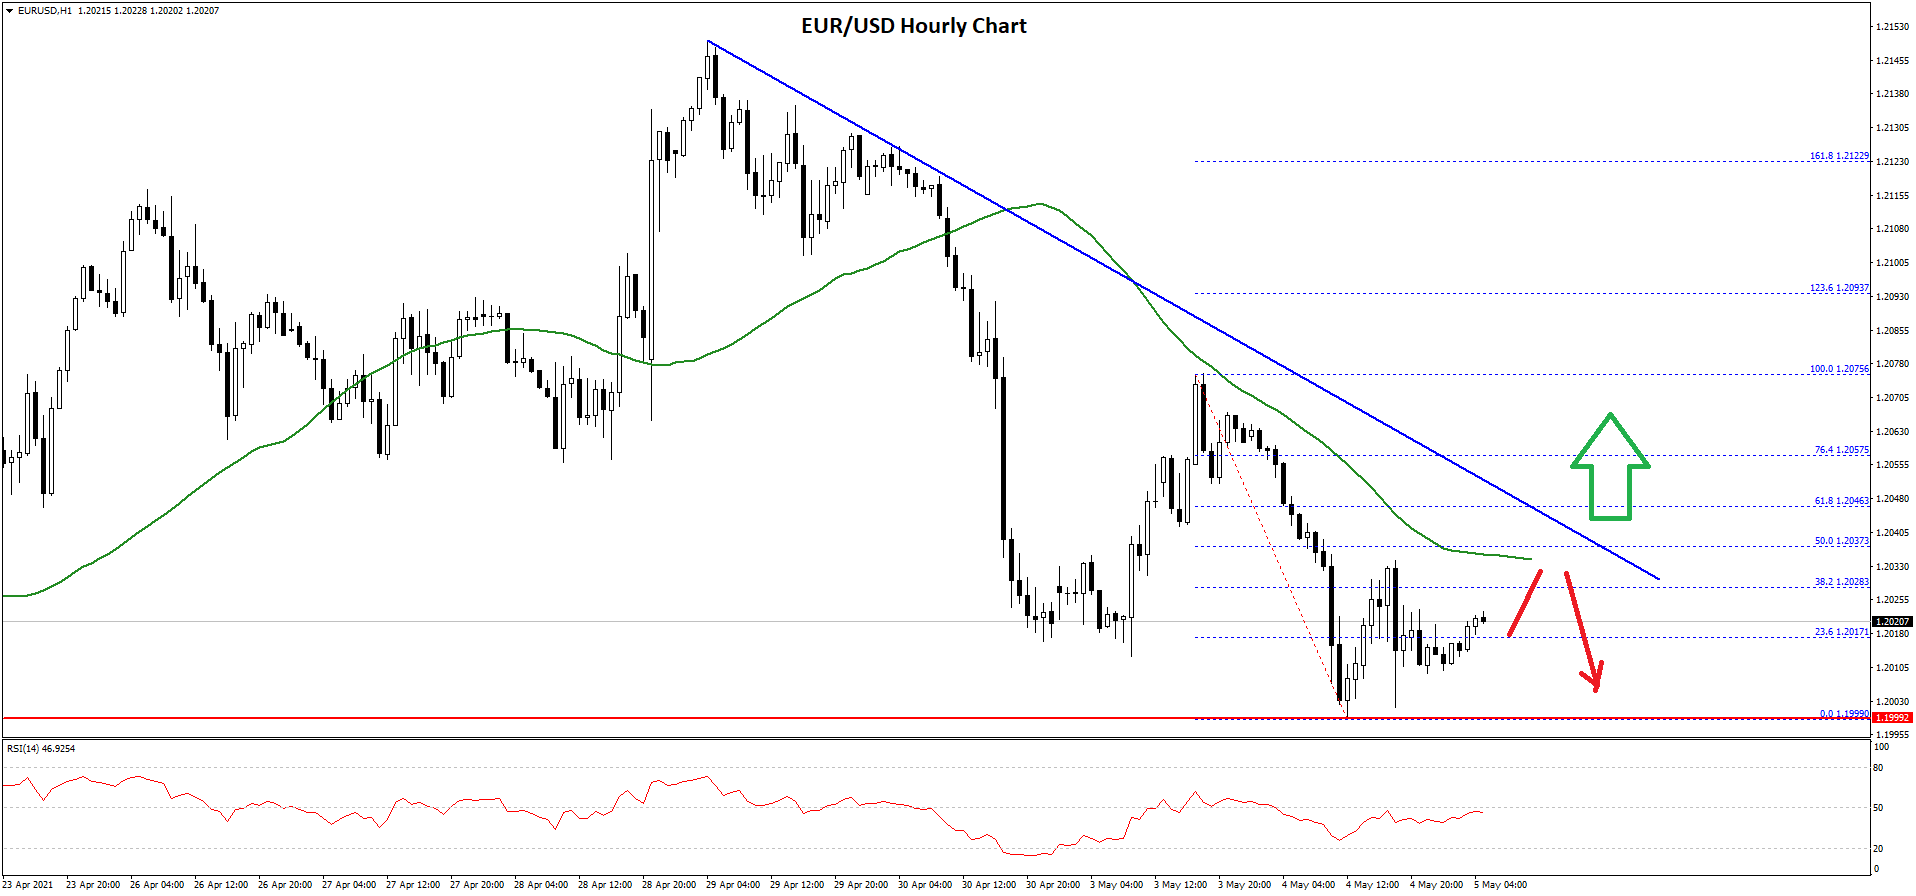
After a spike above the 1.2125 level, the Euro faced a fresh round of selling against the US Dollar. As a result, the EUR/USD pair started a fresh decline below the 1.2100 pivot level.
The pair broke a few key supports near 1.2080 and 1.2050. It even spiked below the 1.2000 level and settled well below the 50 hourly simple moving average. A low is formed near 1.1999 on FXOpen and the pair is correcting higher.
There was a break above the 23.6% Fib retracement level of the recent decline from the 1.2075 high to 1.1999 low. The first major resistance on the upside is near the 1.2035 level.
There is also a key bearish trend line forming with resistance near 1.2040 on the hourly chart of EUR/USD. The trend line is close to the 50% Fib retracement level of the recent decline from the 1.2075 high to 1.1999 low.
The 50 hourly simple moving average is also near the 1.2035 zone to act as a hurdle. If there is an upside break above the 50 hourly simple moving average and the trend line, the pair could rise further towards the 1.2100 pivot level.
If not, there is a risk of more downsides below 1.2010. The main support is near 1.2000. A close below 1.2000 could open the doors for a move towards the 1.1920 support.
USD/JPY Technical Analysis
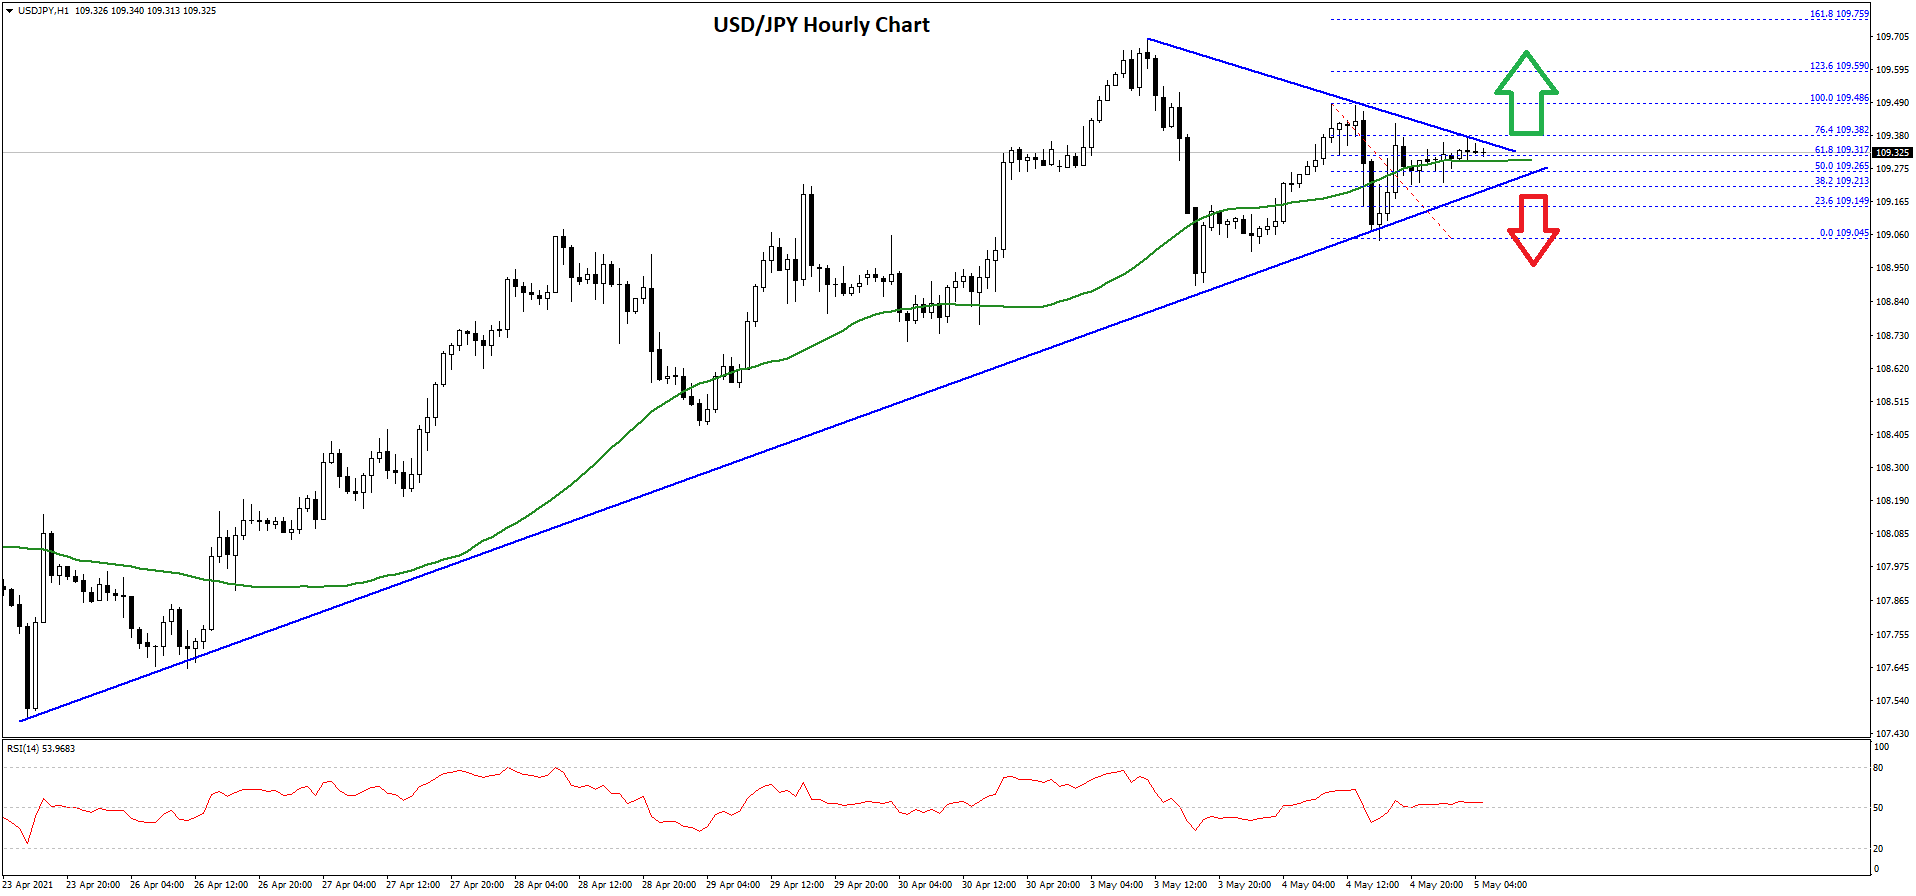
The US Dollar formed a base above the 108.00 level and started a fresh increase against the Japanese Yen. The USD/JPY pair broke the 108.50 resistance to move into a positive zone.
There was also a break above the 109.00 resistance and the 50 hourly simple moving average. A high was formed near 109.65 before the pair corrected lower. The recent swing high was near 109.48 before the pair dropped to 109.04.
It is now consolidating above 109.00 and below the 50 hourly simple moving average. There was a break above the 50% Fib retracement level of the recent decline from the 109.48 high to 109.04 low.
It seems like there is a major breakout pattern forming with resistance near 109.38 on the hourly chart. The triangle resistance is near the 76.4% Fib retracement level of the recent decline from the 109.48 high to 109.04 low.
The 50 hourly simple moving average is also near the triangle resistance. If the pair breaks the 109.35 and 109.40 resistance levels, it could start a strong increase.
In the stated case, the USD/JPY pair might rise steadily towards the 110.00 level. Conversely, it might start a fresh decline below 109.20. The next major support is near the 108.80 level. Any more losses might call for a move towards the 108.00 support zone in the near term.
This forecast represents FXOpen Markets Limited opinion only, it should not be construed as an offer, invitation or recommendation in respect to FXOpen Markets Limited products and services or as financial advice.