EUR/USD Recovering While USD/JPY Tumbling
EUR/USD started a fresh increase and it recently traded above the 1.1035 resistance area. Conversely, USD/JPY is under a lot of selling pressure and it traded below the 109.00 support area.
Important Takeaways for EUR/USD and USD/JPY
- The Euro is showing positive signs above the 1.1035 and 1.1050 resistance levels.
- There is a short term ascending channel forming with support near 1.1075 on the hourly chart of EUR/USD.
- USD/JPY started a major downward move after it failed to surpass the 109.75 resistance area.
- The pair traded below a couple of important bullish trend lines near 109.50 on the hourly chart.
EUR/USD Technical Analysis
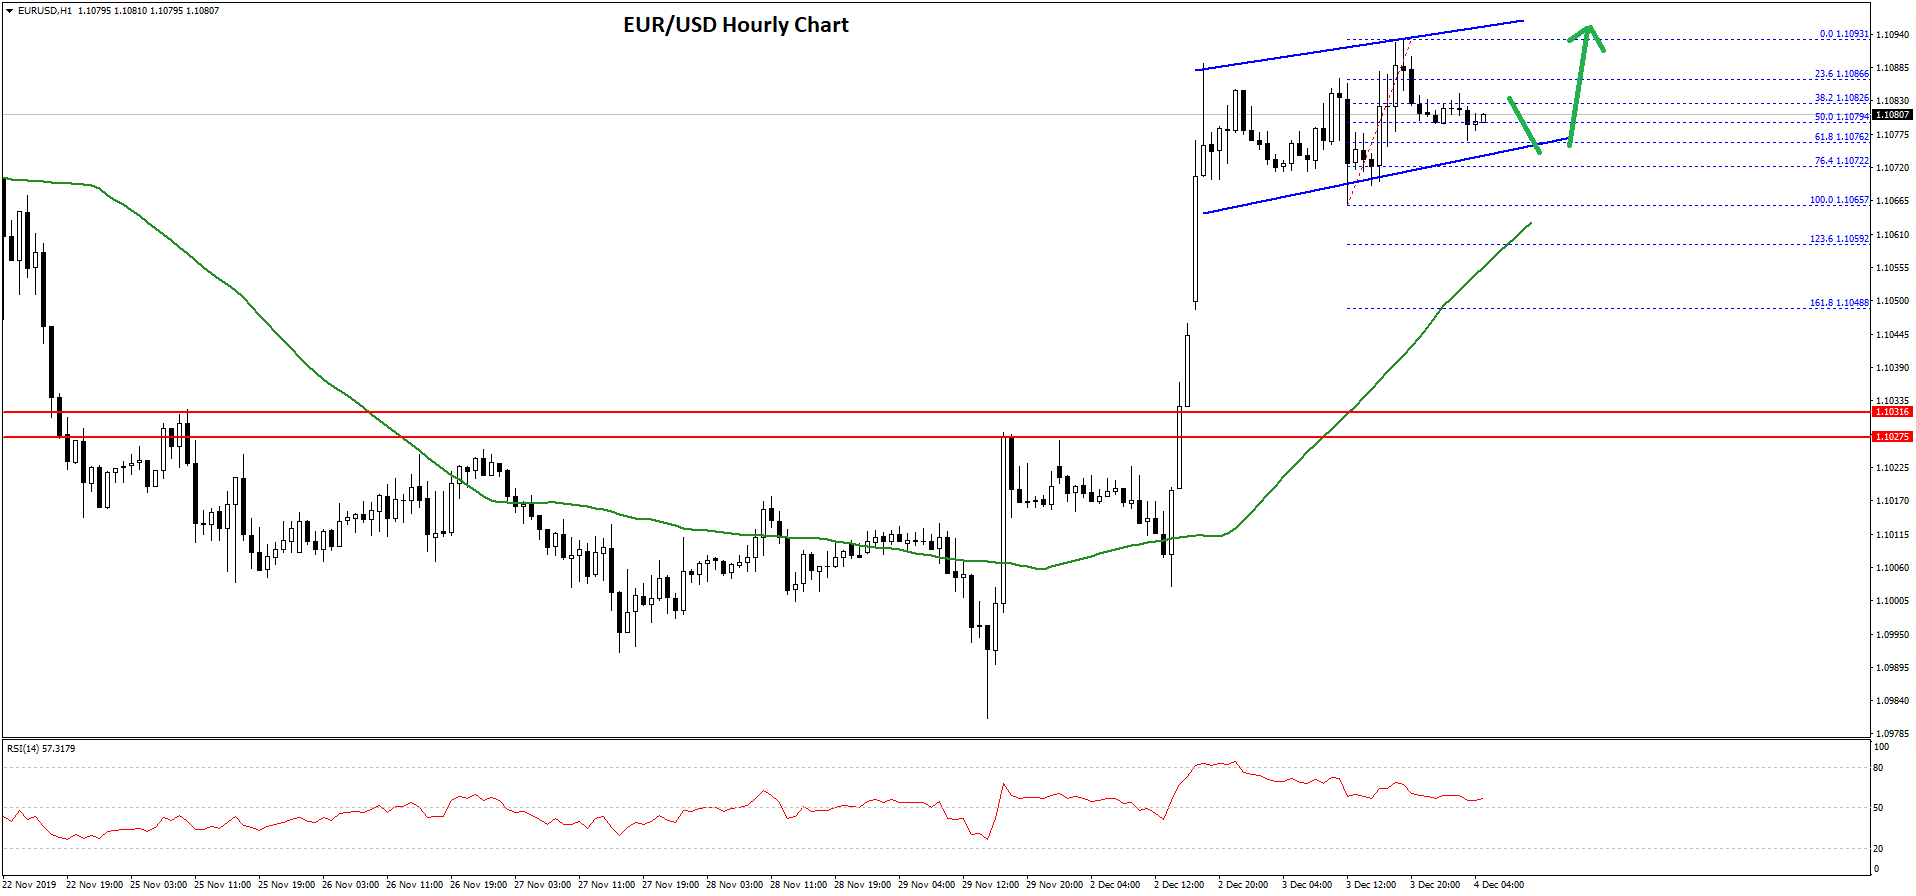
The Euro remained well bid above the 1.0980 support area against the US Dollar. As a result, the EUR/USD pair started a fresh increase above the 1.1000 and 1.1020 resistance levels.
During the recovery, the pair broke a major resistance area near the 1.1035 level. Moreover, there was a close above the 1.1050 level and 50 hourly simple moving average. It opened the doors for more gains and the pair traded towards the 1.1090 level.
A high was formed near 1.1093 on FXOpen and the pair is currently consolidating gains. Recently, it corrected below the 50% Fib retracement level of the upward move from the 1.1065 low to 1.1093 high.
However, the 1.1075 level seems to be providing support. Besides, there is a short term ascending channel forming with support near 1.1075 on the hourly chart of EUR/USD.
The 61.8% Fib retracement level of the upward move from the 1.1065 low to 1.1093 high is also near 1.1075. Therefore, a downside break below 1.1075 and 1.1065 could start a major downside correction towards the 1.1050 and 1.1035 support levels.
On the upside, an initial resistance is near the 1.1090 and 1.1100 levels. A clear break above the 1.1100 resistance area could set the pace for a strong rise towards the 1.1140 and 1.1150 resistance levels in the near term.
USD/JPY Technical Analysis
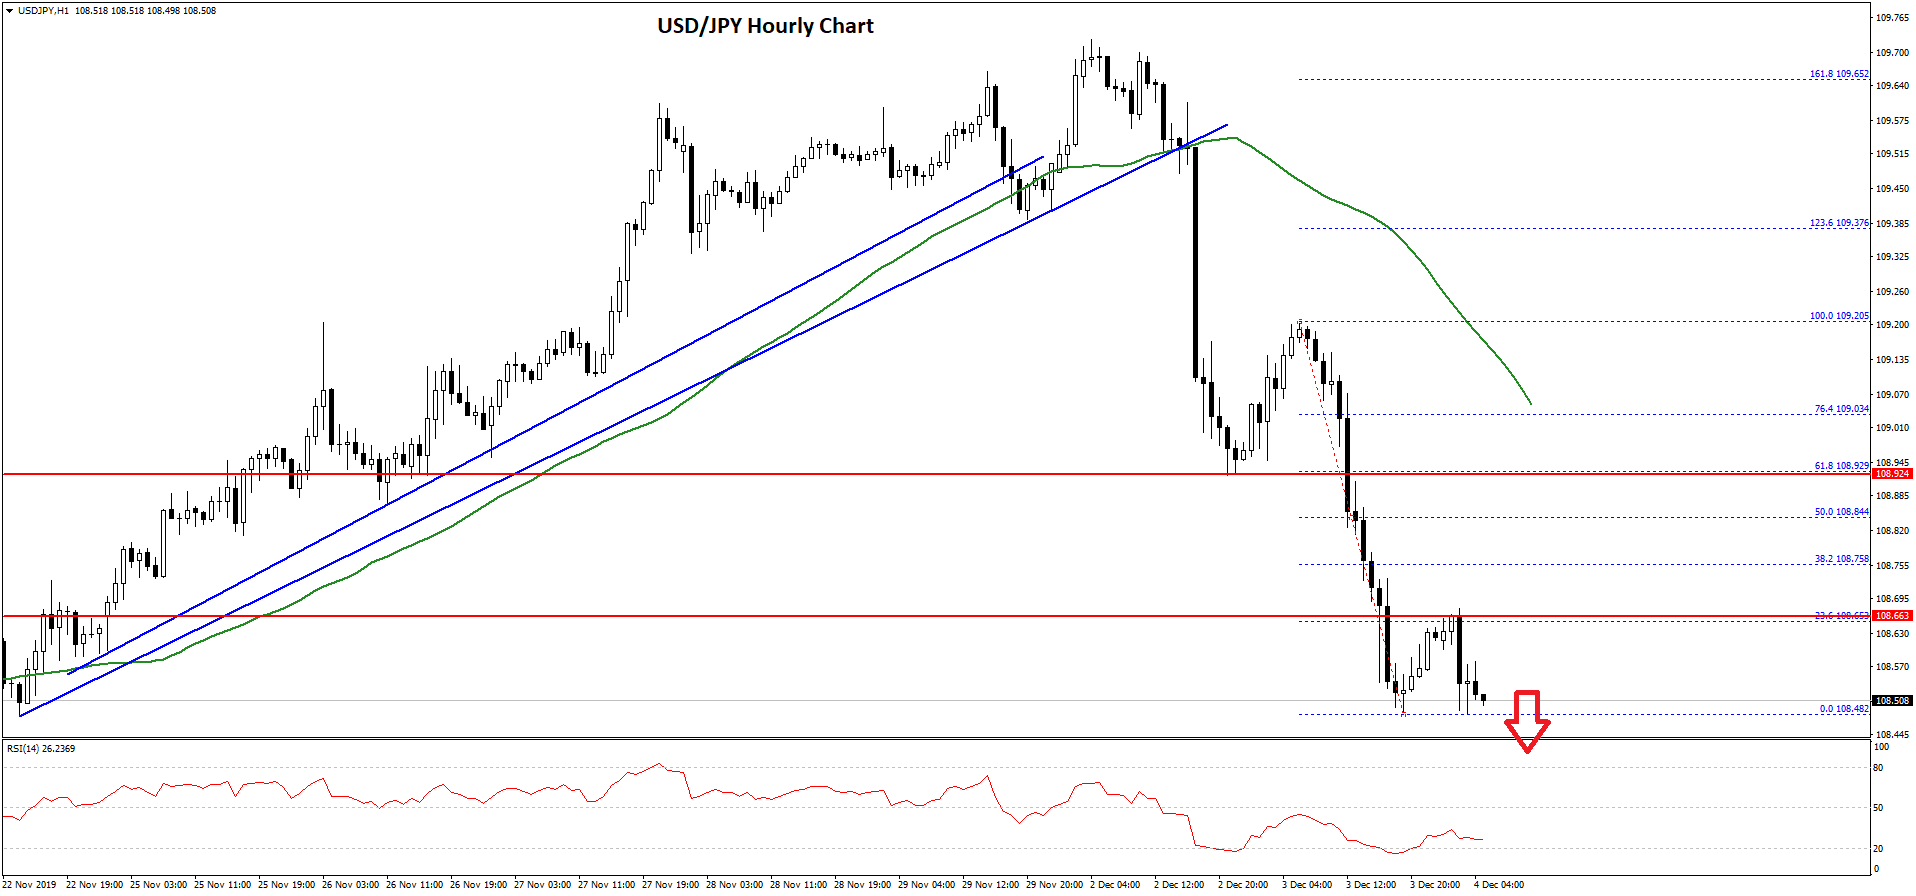
The US Dollar struggled to clear the 109.70 and 109.80 resistance levels against the Japanese Yen. As a result, the USD/JPY pair started a strong decline below the 109.50 support area.
Moreover, the pair traded below a couple of important bullish trend lines near 109.50 on the hourly chart. The decline was such that the pair tumbled below the 109.00 support and the 50 hourly simple moving average.
Finally, the price traded below the 108.65 support and a new weekly low was formed near 108.48. The pair is still trading with a bearish angle below the 108.65 level.
An immediate resistance is near the 23.6% Fib retracement level of the recent decline from the 109.20 high to 108.48 low. If there is an upside correction above the 108.65 level, the pair could test the 108.80 resistance.
Besides, the 50% Fib retracement level of the recent decline from the 109.20 high to 108.48 low may perhaps act as a strong resistance near the 108.85 level.
On the downside, an initial support is near the 108.45 level. If USD/JPY fails to stay above 108.45 and 108.40, there is a risk of an extended decline towards the 108.00 support area in the near term. Any further losses could lead the pair towards 107.85.