


FXOpen
EUR/USD started a fresh increase above the 1.1300 resistance. USD/JPY is declining and might accelerate lower below the 113.00 support.
Important Takeaways for EUR/USD and USD/JPY
· The Euro started a steady increase above the 1.1280 and 1.1300 resistance levels.
· There is a major bullish trend line forming with support near 1.1270 on the hourly chart of EUR/USD.
· USD/JPY started a fresh decline from well above the 114.50 level.
· There is a key bearish trend line forming with resistance near 113.55 on the hourly chart.
EUR/USD Technical Analysis
This week, the Euro started a steady increase above the 1.1280 resistance against the US Dollar. The EUR/USD pair gained pace for a move above the 1.1300 resistance.
The pair even broke the 1.1320 level and settled above the 50 hourly simple moving average. A high was formed near 1.1382 and there was a downside correction. A low was formed near 1.1235 on FXOpen and the pair is now rising.
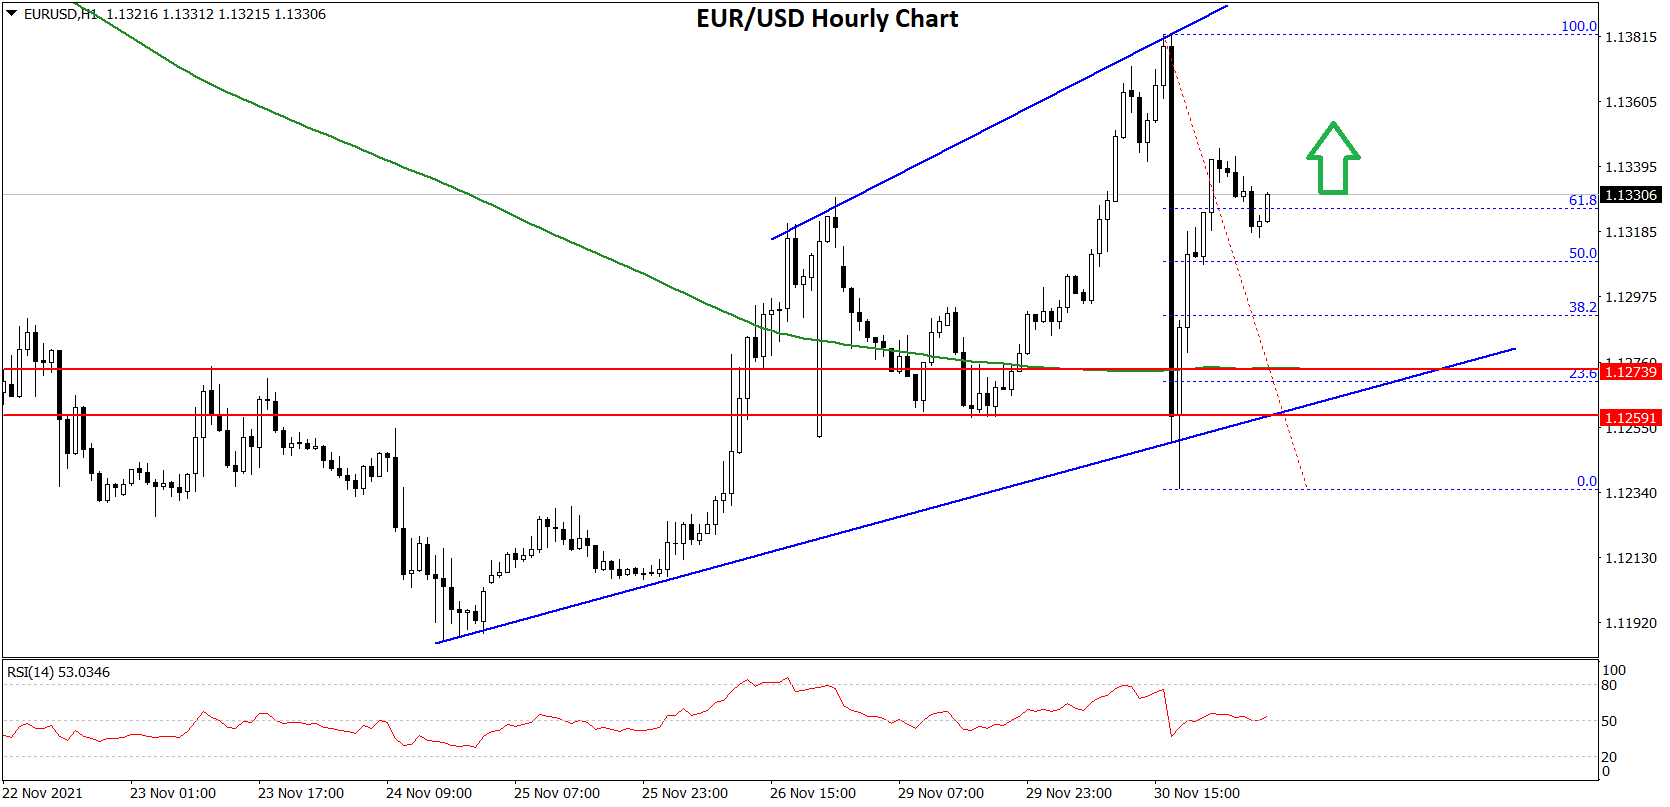
It broke the 50% Fib retracement level of the recent decline from the 1.1382 swing high to 1.1235 low. An immediate resistance on the upside is near the 1.1340 level.
The next major resistance is near the 1.1360 level. It is near the 76.4% Fib retracement level of the recent decline from the 1.1382 swing high to 1.1235 low. The main resistance is near the 1.1380 level, above which the pair could accelerate higher.
If there is no break above 1.1360, the pair might start a downside correction. An immediate support is near the 1.1280. The next major support is near 1.1270.
There is also a major bullish trend line forming with support near 1.1270 on the hourly chart of EUR/USD. Any more losses might push the EUR/USD pair towards the 1.1220 support in the near term.
USD/JPY Technical Analysis
The US Dollar started a fresh a major decline from well above 115.00 against the Japanese Yen. The USD/JPY pair broke the 114.50 and 114.20 support levels to move into a bearish zone.
The pair even declined below the 113.50 level and the 50 hourly simple moving average. A low was formed near 112.51 and is currently correcting higher. There was a recovery wave above the 113.20 level.
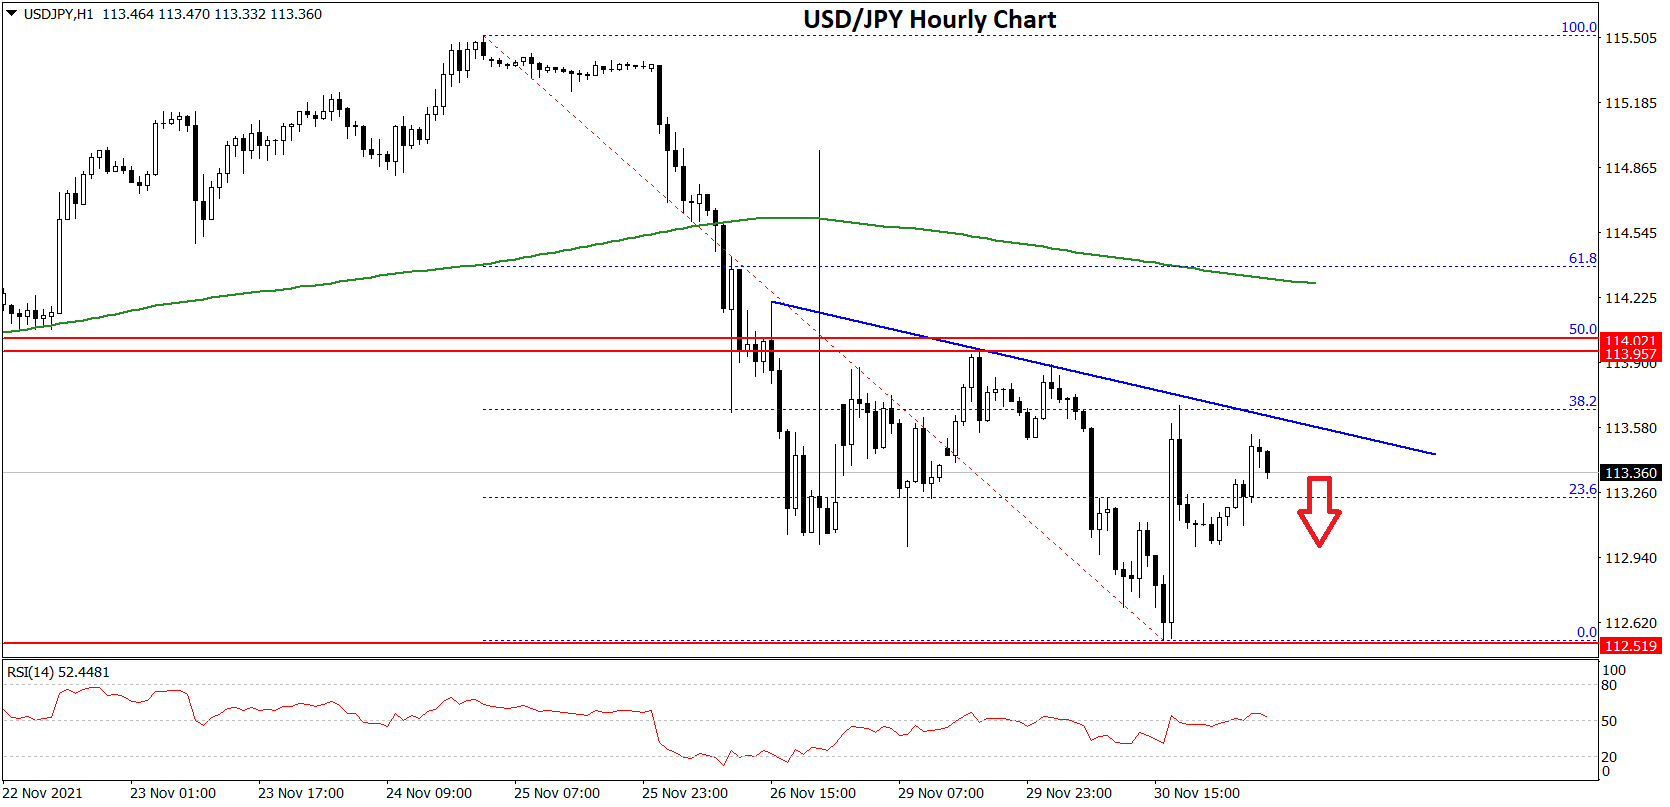
The pair surpassed the 23.6% Fib retracement level of the downward move from the 115.50 swing high to 112.51 low. On the upside, an initial resistance is near the 113.50 level.
There is also a key bearish trend line forming with resistance near 113.55 on the hourly chart. The next major resistance is near the 113.60, above which the pair is likely to rise steadily towards 114.00 in the coming sessions.
It is close to the 50% Fib retracement level of the downward move from the 115.50 swing high to 112.51 low. If not, it could resume its decline below 113.20. The next major support is near the 113.00 level.
Any more downsides might lead the pair towards the 112.50 support zone. If there is a downside break below the 112.50 support, the pair could decline towards the 112.00 level.
This forecast represents FXOpen Markets Limited opinion only, it should not be construed as an offer, invitation or recommendation in respect to FXOpen Markets Limited products and services or as financial advice.
This article represents the opinion of the Companies operating under the FXOpen brand only. It is not to be construed as an offer, solicitation, or recommendation with respect to products and services provided by the Companies operating under the FXOpen brand, nor is it to be considered financial advice.
Stay ahead of the market!
Subscribe now to our mailing list and receive the latest market news and insights delivered directly to your inbox.

Latest articles

Weak Data Weigh on the Dollar: Market Awaits Trend Confirmation
The US dollar is retreating from recent highs, moving into a moderate correction after a prolonged period of gains. Pressure on the currency is building amid weaker-than-expected macroeconomic data, while market participants adopt a wait-and-see approach ahead of key labour

Market Analysis: EUR/USD Aims Recovery While USD/JPY Gives Back Recent Gains
EUR/USD is recovering losses from 1.1450. USD/JPY is correcting gains from 160.50 and might decline further below 158.00.
Important Takeaways for EUR/USD and USD/JPY Analysis Today
· The Euro struggled to stay in a

European Currencies Decline: Pound Hits New Lows, Euro Under Pressure
European currencies continue to weaken against the US dollar amid rising geopolitical tensions and increased demand for safe-haven and liquid assets. Market participants are reducing exposure to riskier instruments, putting pressure on both the euro and the pound. Additional support