


EUR/USD Turned Bullish, USD/JPY Could Decline Further
FXOpen
EUR/USD gained bullish momentum recently and broke the 1.1360 resistance. USD/JPY is currently under pressure and upsides are likely to be capped near 110.70.
Important Takeaways for EUR/USD and USD/JPY
- The Euro started a decent recovery from the 1.1285 swing low and traded above 1.1320.
- There is a key bullish trend line in place with support at 1.1355 on the hourly chart of EUR/USD.
- USD/JPY broke a key bullish trend line with support at 110.70 n the hourly chart.
- The pair is currently correcting higher, but it could face sellers near 110.70 and 110.80.
EUR/USD Technical Analysis
After a strong decline, the Euro found support near the 1.1250 and 1.1260 levels against the US Dollar. The EUR/USD pair started a decent upward move and broke the 1.1285 and 1.1320 resistance levels.
The recent upward move was strong as the pair was able to clear the 1.1360 and 1.1380 resistance levels. There was even a close above the 1.1360 level and the 50 hourly simple moving average. The pair traded as high as 1.1402 on FXOpen and later corrected lower.
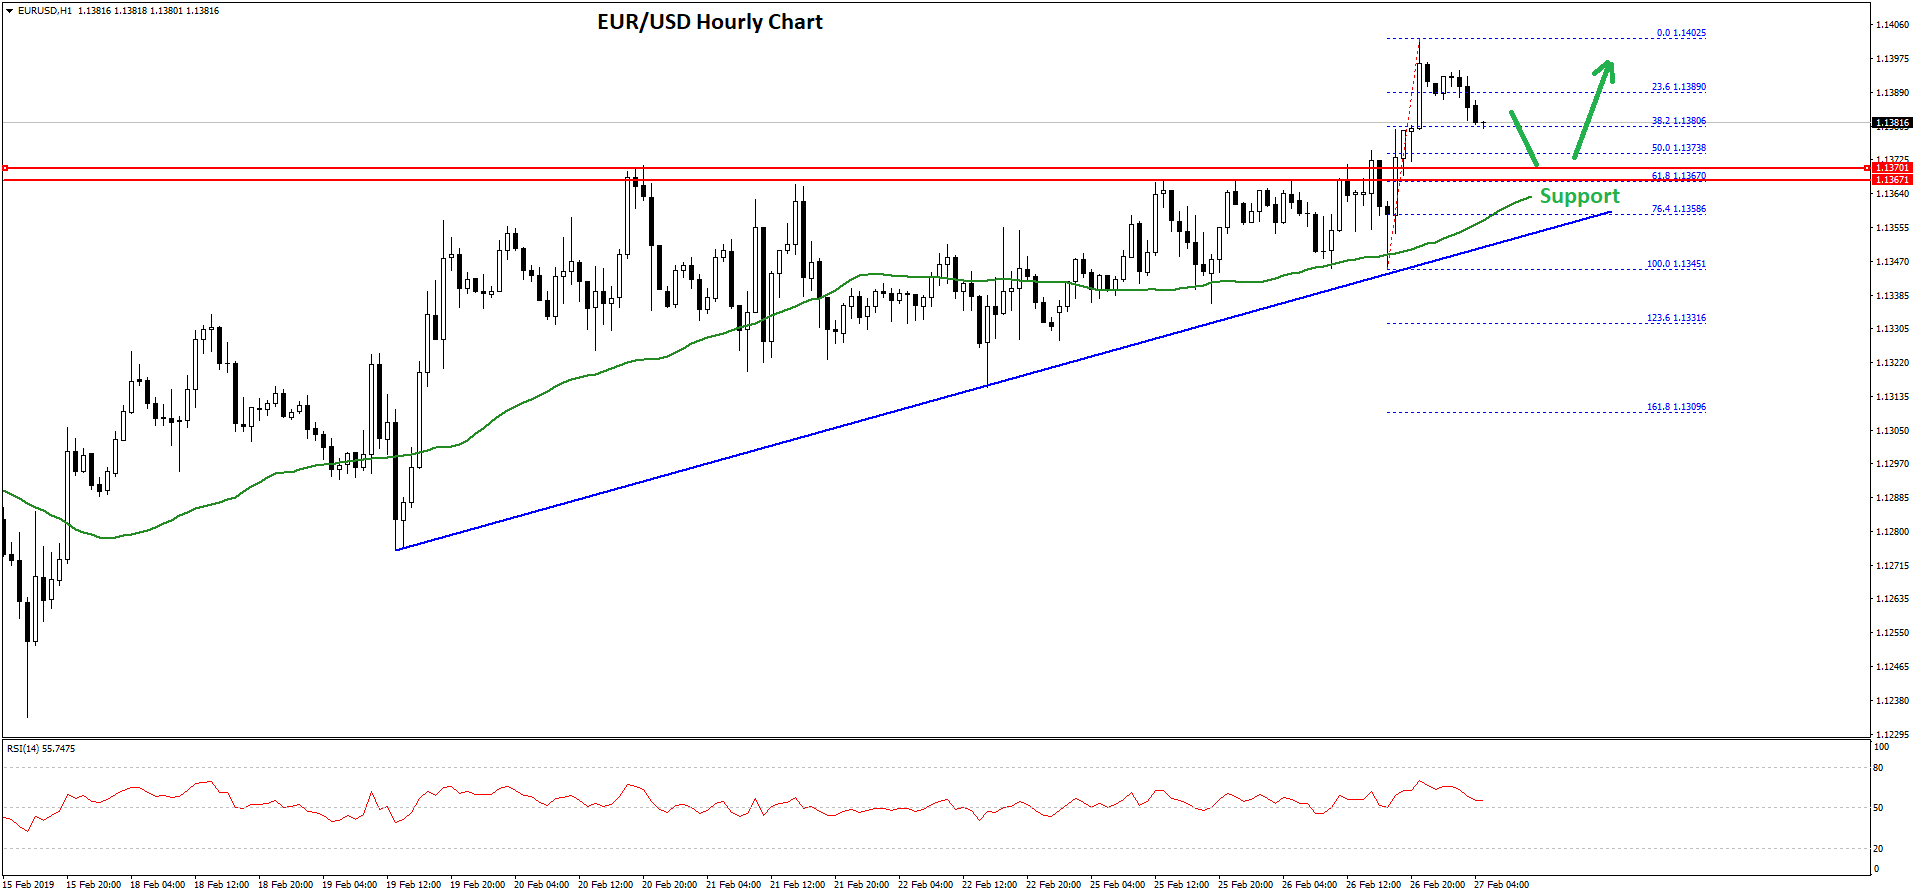
It broke the 1.1390 support and the 23.6% Fib retracement level of the recent wave from the 1.1345 low to 1.1402 high. However, there are many supports on the downside near the 1.1360 level.
There is also a key bullish trend line in place with support at 1.1355 on the hourly chart of EUR/USD. Above the trend line, the 50% Fib retracement level of the recent wave from the 1.1345 low to 1.1402 high is at 1.1373.
Therefore, if the pair continues to correct lower, it could find a strong support between the 1.1355 and 1.1370 levels. If there is a break below the 1.1355 support, the pair could trade towards the 1.1320 support.
On the upside, an initial resistance is near the 1.1400 level, above which EUR/USD is likely to extend gains towards the 1.1420 and 1.1440 resistance levels.
USD/JPY Technical Analysis
The US Dollar formed a crucial top near the 111.25 level and later declined against the Japanese Yen. The USD/JPY pair declined heavily and broke the 111.00 and 110.80 support levels to move into a bearish zone.
There was also a break below a key bullish trend line with support at 110.70 n the hourly chart. The pair even settled below the 110.70 level and the 50 hourly simple moving average.
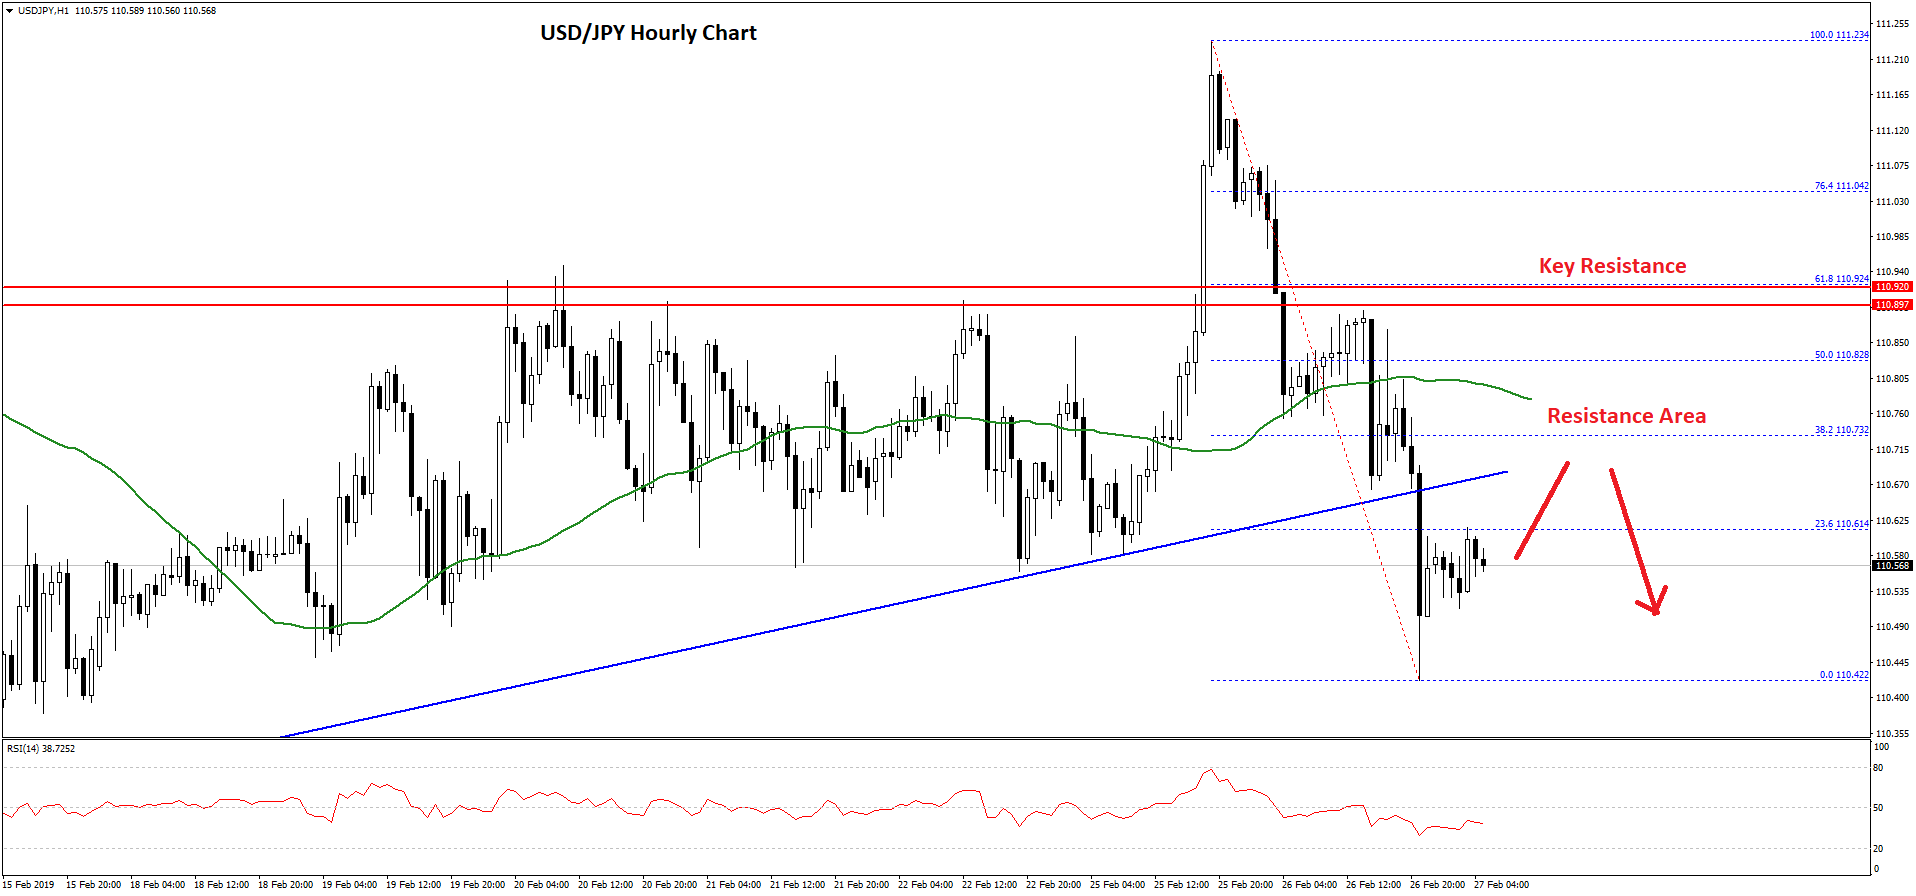
It traded as low as 110.42 and later the pair started an upside correction towards the 23.6% Fib retracement level of the last decline from the 111.23 high to 110.42 low. On the upside, there are many resistances near the 110.70 level and the 50 hourly simple moving average.
The main resistance is near 110.80 and the 50% Fib retracement level of the last decline from the 111.23 high to 110.42 low. Having said that, the pair must gain traction above the 110.90 pivot level to move into a bullish zone.
On the other hand, if USD/JPY fails to correct higher, it could decline further in the near term below 110.50. The next key support is near the 110.40 level, below which the pair could revisit the 110.00 support area.
Trade over 50 forex markets 24 hours a day with FXOpen. Take advantage of low commissions, deep liquidity, and spreads from 0.0 pips (additional fees may apply). Open your FXOpen account now or learn more about trading forex with FXOpen.
This article represents the opinion of the Companies operating under the FXOpen brand only. It is not to be construed as an offer, solicitation, or recommendation with respect to products and services provided by the Companies operating under the FXOpen brand, nor is it to be considered financial advice.
Stay ahead of the market!
Subscribe now to our mailing list and receive the latest market news and insights delivered directly to your inbox.


Latest articles

EUR/USD Eyes Gains As USD/CHF Weakness Deepens Again
EUR/USD started a fresh increase above 1.1700 and 1.1720. USD/CHF declined further and is now struggling below 0.7835.
Important Takeaways for EUR/USD and USD/CHF Analysis Today
· The Euro started a decent increase from

Apple: Earnings Day Above the Activity Zone
On 30 April, after the market close, Apple Inc. will release its financial results for the second quarter of fiscal 2026. The consensus forecast, based on estimates from 31 analysts, points to revenue of around $109.7 billion, with expected

USD/JPY and USD/CHF Near Key Levels: The Dollar Supported by the Fed
The US dollar continues to trend upwards following the Federal Reserve meeting, drawing support from the regulator’s moderately hawkish stance and comments by Jerome Powell. Markets interpret the Fed’s rhetoric as a signal that restrictive policy is likely