


FXOpen
The bearish wave that started by the mid of the last week is finding support around 0.7906, the 50% Fibonacci level and the trend line. The price already broke out the support around 0.7923, the 50 SMA.
The price is expected to start the second bullish wave around 50% fib level ahead of 0.7850, the psychological number and then the 61.8% fib level. The 50 SMA and 100 SMA are also getting closer that shows the market is preparing for the potential rebound.
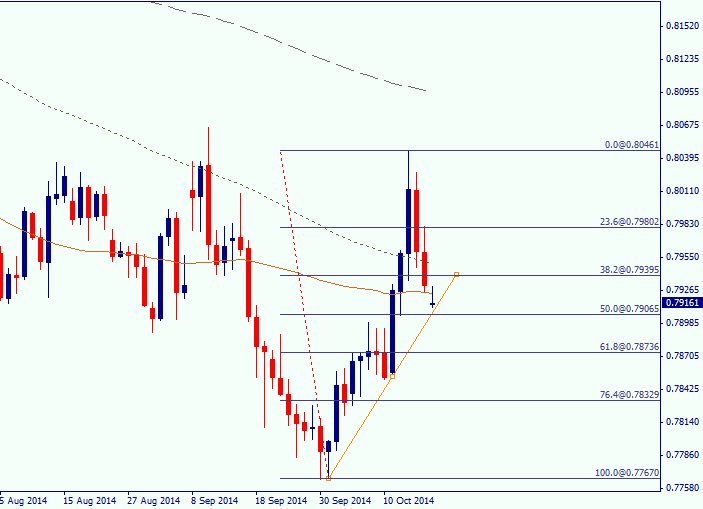
As of this writing, the price is being traded at 0.7914, the same price that opened the Asian session today. Bulls and bears are struggling equally, causing indecision in the market.
On the upside, there lies a resistance around 0.8035, breaking which the EUR/GBP may hit 0.8065, the September high.
Fundamental Analysis
Today’s economic calendar contains the following releases for the Euro and the GBP.
Rightmove House Price Index (YoY)
The Rightmove House Price Index for this October is 7.6%, below than that of the previous month which was 7.9%. Generally speaking, a high reading is considered positive (bullish) for GBP while a low reading is considered negative (bearish) for the GBP.
Producer Price Index (YoY)
The Producer Price Index for this September is -1.0% as compared to -0.8% of the same month of the previous year. As an indicator of commodity inflation, a high reading is bullish for the Euro and a low reading is bearish.
Trading strategy
Considering the fundamental and technical analysis, there is no actionable opportunity yet. However, long position can be considered if the price pulls back from the 50% fib level, the probable reversal zone.
Trade over 50 forex markets 24 hours a day with FXOpen. Take advantage of low commissions, deep liquidity, and spreads from 0.0 pips (additional fees may apply). Open your FXOpen account now or learn more about trading forex with FXOpen.
This article represents the opinion of the Companies operating under the FXOpen brand only. It is not to be construed as an offer, solicitation, or recommendation with respect to products and services provided by the Companies operating under the FXOpen brand, nor is it to be considered financial advice.
Stay ahead of the market!
Subscribe now to our mailing list and receive the latest market news and insights delivered directly to your inbox.


Latest articles

Dollar Index (DXY) Hits Yearly High
Today, the dollar index rose above last week’s peak around the 99.68 level, setting a new high for 2026. This movement is supported by a tense fundamental backdrop:
→ Inflationary pressures from rising oil prices. Markets may be pricing

WTI Oil Price Rises Above $100
Another shocking Monday for the energy market. Last week’s start was remembered for a bullish gap of more than 10% (which was later followed by a pullback), but today’s market open proved even more volatile (as reflected by

Market Analysis: AUD/USD and NZD/USD Struggle as Market Jitters Shake Risk Sentiment
AUD/USD failed to stay in a positive zone and declined below 0.7000. NZD/USD is also moving lower and might extend losses below 0.5850.
Important Takeaways for AUD/USD and NZD/USD Analysis Today
· The Aussie Dollar