


EUR/USD Broke Key Support While USD/CHF Climbed Higher
FXOpen
EUR/USD faced sellers near the 1.1720 level and declined below 1.1670. On the other hand, USD/CHF formed a bottom at 0.9855 and climbed above the 0.9900 resistance.
Important Takeaways for EUR/USD and USD/CHF
- The Euro likely formed a short-term top near the 1.1720 level against the US Dollar.
- The EUR/USD pair broke a connecting bullish trend line with support at 1.1690 on the hourly chart.
- USD/JPY moved higher and broke the 0.9880 and 0.9900 resistance levels.
- It remains buy on dips near the 0.9880 level and the 50 hourly simple moving average.
EUR/USD Technical Analysis
The Euro started a decent upside move from the 1.1500 swing low against the US Dollar. The EUR/USD pair traded above the 1.1600 and 1.1700 resistance levels.
However, the upside move was capped by the 1.1720. Later, the pair started a downside move and broke the 1.1700 support. More importantly, there was a break below a connecting bullish trend line with support at 1.1690 on the hourly chart.
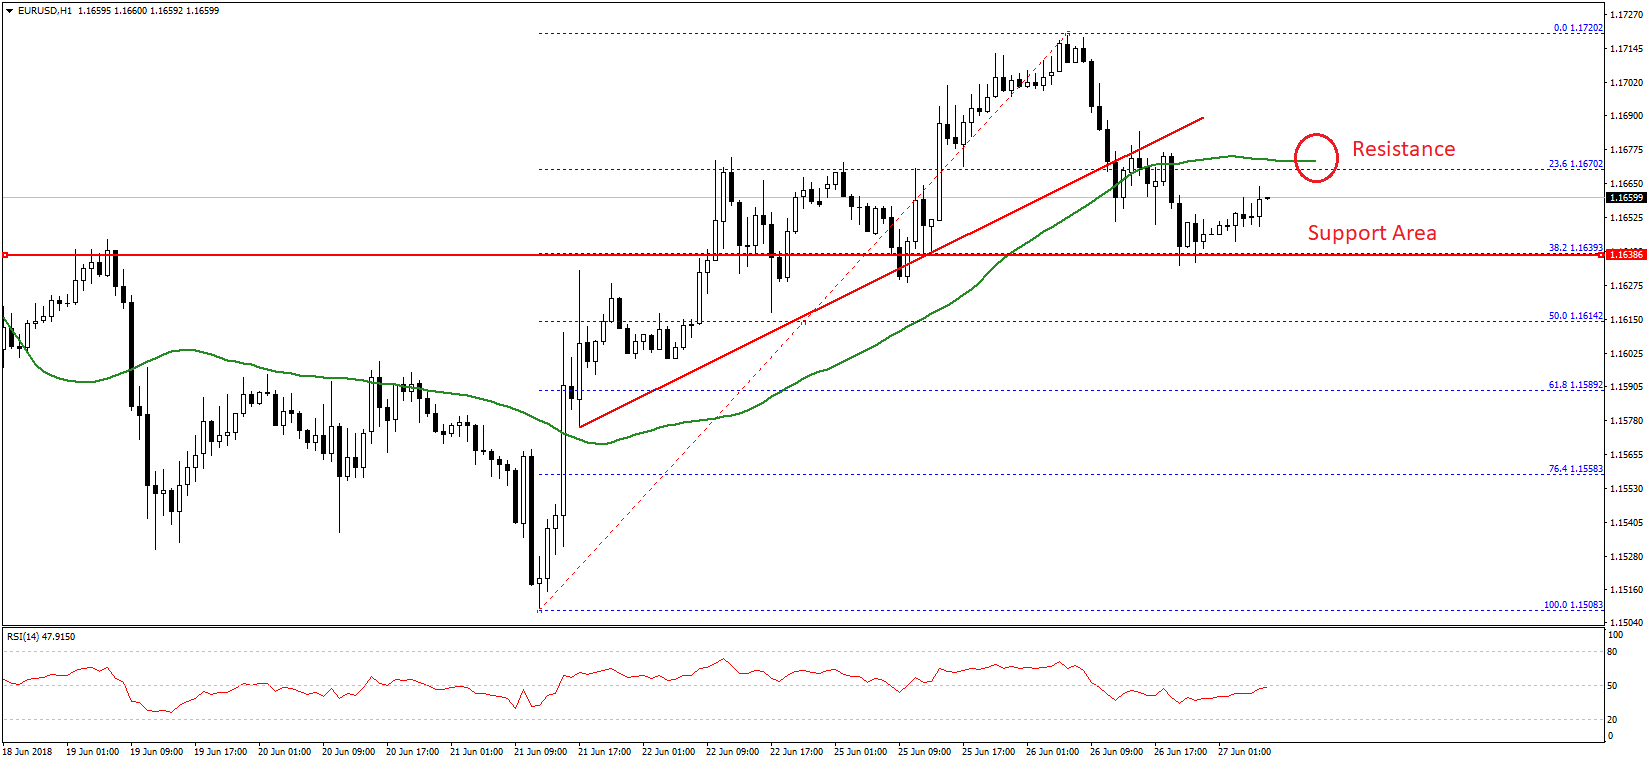
The pair settled below the 1.1720 level and the 50 hourly simple moving average. It tested the 38.2% Fib retracement level of the last wave from the 1.1508 low to 1.1720 high at 1.1640.
The stated 1.1640 level was a resistance earlier and is currently acting as a support. At the moment, the pair is moving higher, but it is likely to face sellers near the 1.1675 resistance and the 50 hourly SMA. Only above 1.1680, the pair could break 1.1700 and even 1.1720 in the near term.
On the flip side, if the pair fails to hold the 1.1640 support, it could test the 50% Fib retracement level of the last wave from the 1.1508 low to 1.1720 high at 1.1614. Below this, there are chances that the pair may revisit 1.1600.
USD/CHF Technical Analysis
After a major decline, the US Dollar found support above the 0.9850 level against the Swiss franc. The USD/CHF pair formed a bottom near the 0.9855 level and started an upside recovery.
During the upside, the pair broke the 0.9880 resistance and the 50 hourly simple moving average. Moreover, there was a break above a major bearish trend line with resistance at 0.9870 on the hourly chart.
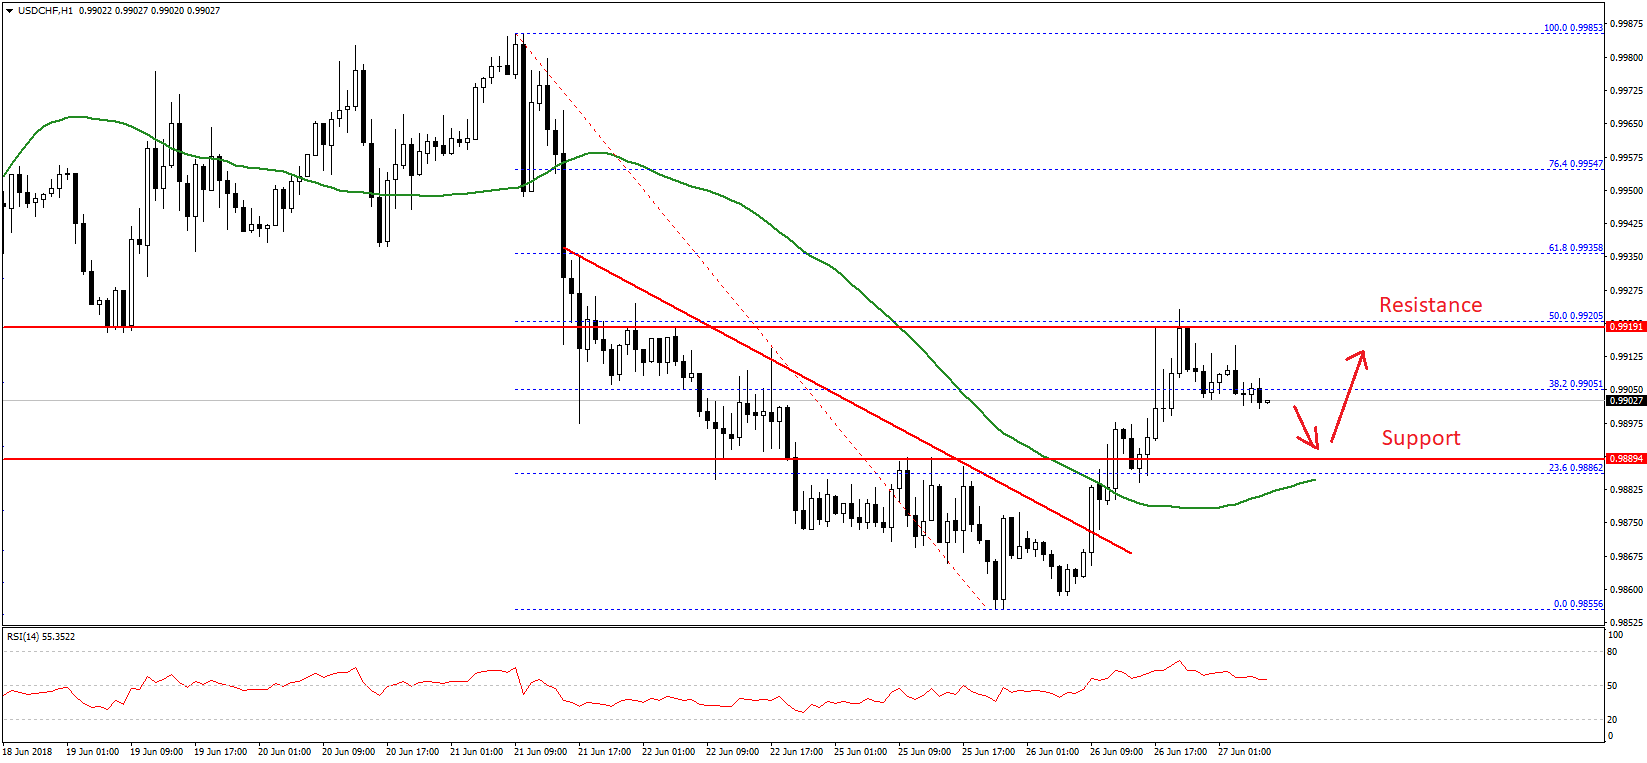
Additionally, there was a break above the 38.2% Fib retracement level of the last decline from the 0.9985 high to 0.9855 low. These all are positive signs and suggests that the pair moved in a bullish zone above the 0.9900 level.
However, the upside move faced a strong selling interest near the 0.9920 level and the 50% Fib retracement level of the last decline from the 0.9985 high to 0.9855 low.
The pair trimmed some of its gains and moved back below the 0.9910 level. On the downside, there are many supports around the 0.9890 and 0.9880 levels. Moreover, the 50 hourly SMA is positioned near the 0.9885 level to stop declines.
Therefore, if the pair corrects lower, buyers are likely to take a stand near the 0.9890 and 0.9880 levels. On the upside, a break above the 0.9920 resistance could open the doors for more gains above the 0.9940 level.
Trade over 50 forex markets 24 hours a day with FXOpen. Take advantage of low commissions, deep liquidity, and spreads from 0.0 pips (additional fees may apply). Open your FXOpen account now or learn more about trading forex with FXOpen.
This article represents the opinion of the Companies operating under the FXOpen brand only. It is not to be construed as an offer, solicitation, or recommendation with respect to products and services provided by the Companies operating under the FXOpen brand, nor is it to be considered financial advice.
Stay ahead of the market!
Subscribe now to our mailing list and receive the latest market news and insights delivered directly to your inbox.


Latest articles

Apple: Earnings Day Above the Activity Zone
On 30 April, after the market close, Apple Inc. will release its financial results for the second quarter of fiscal 2026. The consensus forecast, based on estimates from 31 analysts, points to revenue of around $109.7 billion, with expected

USD/JPY and USD/CHF Near Key Levels: The Dollar Supported by the Fed
The US dollar continues to trend upwards following the Federal Reserve meeting, drawing support from the regulator’s moderately hawkish stance and comments by Jerome Powell. Markets interpret the Fed’s rhetoric as a signal that restrictive policy is likely

EUR/USD and GBP/USD consolidate ahead of the Fed decision
European currencies are showing subdued dynamics, entering a consolidation phase following their previous advance. Earlier, EUR/USD and GBP/USD broke out of their ranges and strengthened; however, the subsequent correction has led both pairs to retest the previously breached