


GBP/USD and EUR/GBP: British Pound Could Decline Further
FXOpen
GBP/USD faced an increase in selling pressure below the 1.2880 pivot level. EUR/GBP is currently correcting higher and it might trade towards the 0.8650 resistance area.
Important Takeaways for GBP/USD and EUR/GBP
- The British Pound declined steadily below the 1.2900 and 1.2840 support levels.
- There is a key bearish trend line forming with resistance near 1.2820 on the hourly chart of GBP/USD.
- EUR/GBP is recovering higher and it is trading above the 0.8600 support area.
- There is a connecting bullish trend line forming with support near 0.8605 on the hourly chart.
GBP/USD Technical Analysis
The British Pound started a fresh downward move from well above the 1.2950 level against the US Dollar. The GBP/USD pair declined steadily below the 1.2900 and 1.2840 support levels.
Moreover, there was a close below the 1.2840 level and the 50 hourly simple moving average. It opened the doors for more losses below the 1.2800 level. Finally, the pair traded as low as 1.2768 on FXOpen.
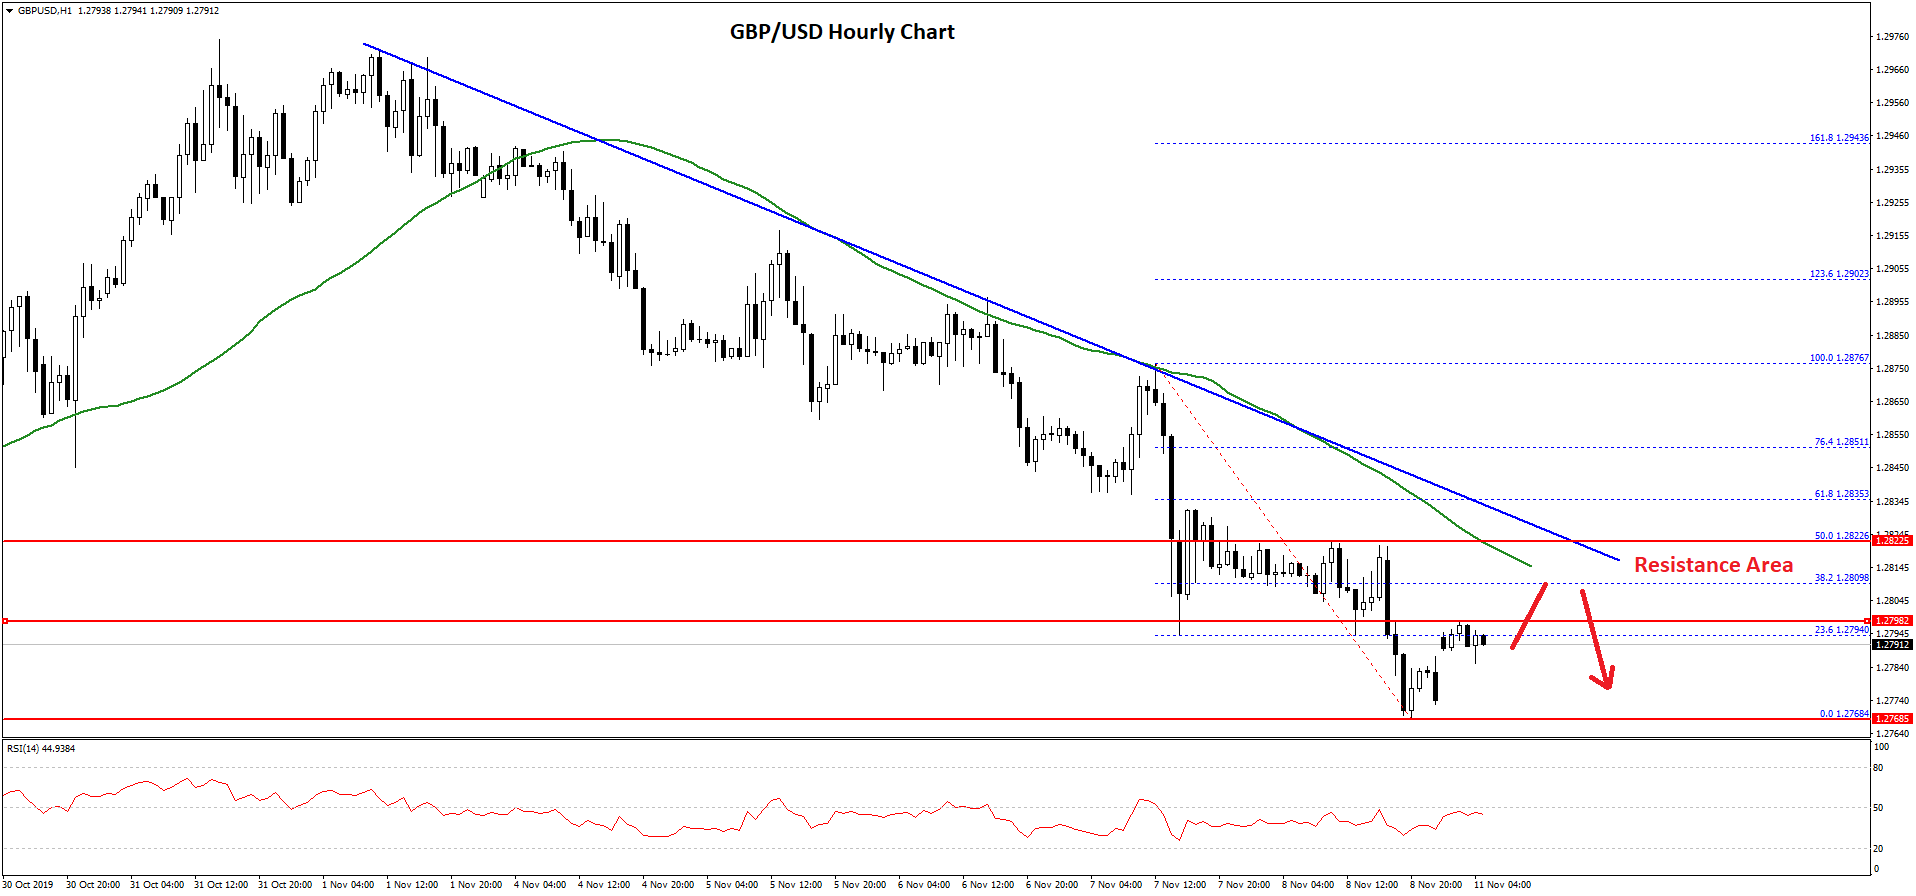
It is currently correcting higher and is trading above the 1.2780 level. At the moment, the pair is testing the 23.6% Fib retracement level of the recent decline from the 1.2876 high to 1.2768 low.
On the upside, there are many resistances near the 1.2800 and 1.2820 levels. Moreover, there is a key bearish trend line forming with resistance near 1.2820 on the hourly chart of GBP/USD.
The trend line resistance is near the 50 hourly simple moving average. More importantly, the 50% Fib retracement level of the recent decline from the 1.2876 high to 1.2768 low is also near the 1.2820 level.
Therefore, the pair is likely to face a strong resistance near the 1.2820 level. If there is a successful close above the 1.2820 resistance and the 50 hourly SMA, there could be decent gains in the coming sessions.
Conversely, the pair might continue to move down below 1.2780. An immediate support is near the 1.2760 level, below which there is a risk of a drop towards the 1.2720 support.
EUR/GBP Technical Analysis
The Euro mostly traded in a broad range below the 0.8650 resistance area against the British Pound. The EUR/GBP pair broke many supports near the 0.8620, but it remained bid above the 0.8600 area.
The last swing low was formed near 0.8597 and the pair is currently correcting higher. There was a break above the 23.6% Fib retracement level of the recent decline from the 0.8657 high to 0.8597 low.
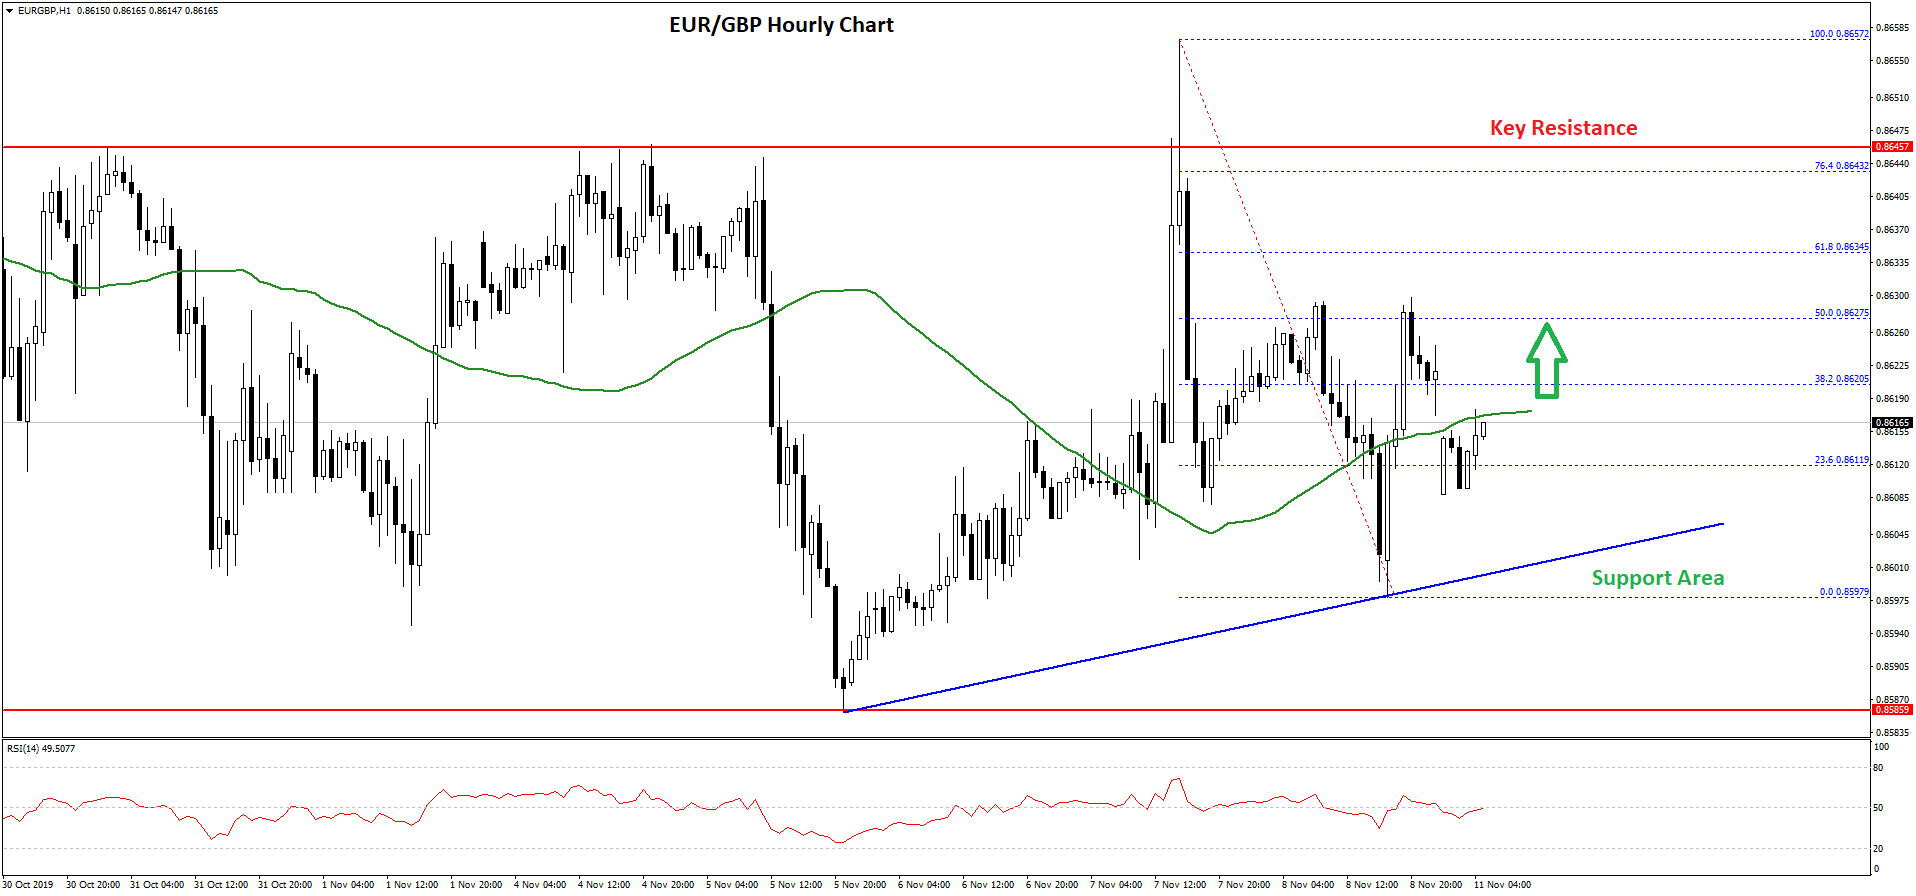
At the moment, the pair is trading near the 0.8620 resistance and the 50 hourly simple moving average. An immediate resistance area is near the 0.8630 level. It coincides with the 50% Fib retracement level of the recent decline from the 0.8657 high to 0.8597 low.
The main resistance is near the 0.8650 level, where the bulls are likely to face a strong selling interest. If there is an upside break, the pair could climb towards 0.8680 or 0.8700.
On the downside, an initial support is near the 0.8600 level. Moreover, there is a connecting bullish trend line forming with support near 0.8605 on the hourly chart.
If there is a downside break below the trend line, the pair could test the 0.8585 level. Any further losses may perhaps push EUR/GBP towards the 0.8550 level.
Trade over 50 forex markets 24 hours a day with FXOpen. Take advantage of low commissions, deep liquidity, and spreads from 0.0 pips (additional fees may apply). Open your FXOpen account now or learn more about trading forex with FXOpen.
This article represents the opinion of the Companies operating under the FXOpen brand only. It is not to be construed as an offer, solicitation, or recommendation with respect to products and services provided by the Companies operating under the FXOpen brand, nor is it to be considered financial advice.
Stay ahead of the market!
Subscribe now to our mailing list and receive the latest market news and insights delivered directly to your inbox.


Latest articles

Apple: Earnings Day Above the Activity Zone
On 30 April, after the market close, Apple Inc. will release its financial results for the second quarter of fiscal 2026. The consensus forecast, based on estimates from 31 analysts, points to revenue of around $109.7 billion, with expected

USD/JPY and USD/CHF Near Key Levels: The Dollar Supported by the Fed
The US dollar continues to trend upwards following the Federal Reserve meeting, drawing support from the regulator’s moderately hawkish stance and comments by Jerome Powell. Markets interpret the Fed’s rhetoric as a signal that restrictive policy is likely

EUR/USD and GBP/USD consolidate ahead of the Fed decision
European currencies are showing subdued dynamics, entering a consolidation phase following their previous advance. Earlier, EUR/USD and GBP/USD broke out of their ranges and strengthened; however, the subsequent correction has led both pairs to retest the previously breached