


GBP/USD and EUR/GBP Consolidating Below Key Resistances
FXOpen
GBP/USD declined recently and settled below the 1.2840-50 support area. EUR/GBP is currently in an uptrend, but it is struggling to break the 0.8920-30 resistance area.
Important Takeaways for GBP/USD and EUR/GBP
- The British Pound broke the 1.2800 support recently and tested the 1.2730 zone.
- There is a major bearish trend line in place with resistance at 1.2820 on the hourly chart of GBP/USD.
- EUR/GBP is currently placed nicely above the 0.8860 support area.
- There is a major resistance trend line in place with resistance at 0.8930 on the hourly chart.
GBP/USD Technical Analysis
The British Pound started a major downside move from well above the 1.2900 support area against the US Dollar. The GBP/USD pair traded lower and broke the 1.2880, 1.2850 and 1.2800 support levels.
The decline was such that the pair even settled below the 1.2800 level and the 50 hourly simple moving average. A low was formed near 1.2730 on FXOpen and later the pair started consolidating in a range above 1.2740.
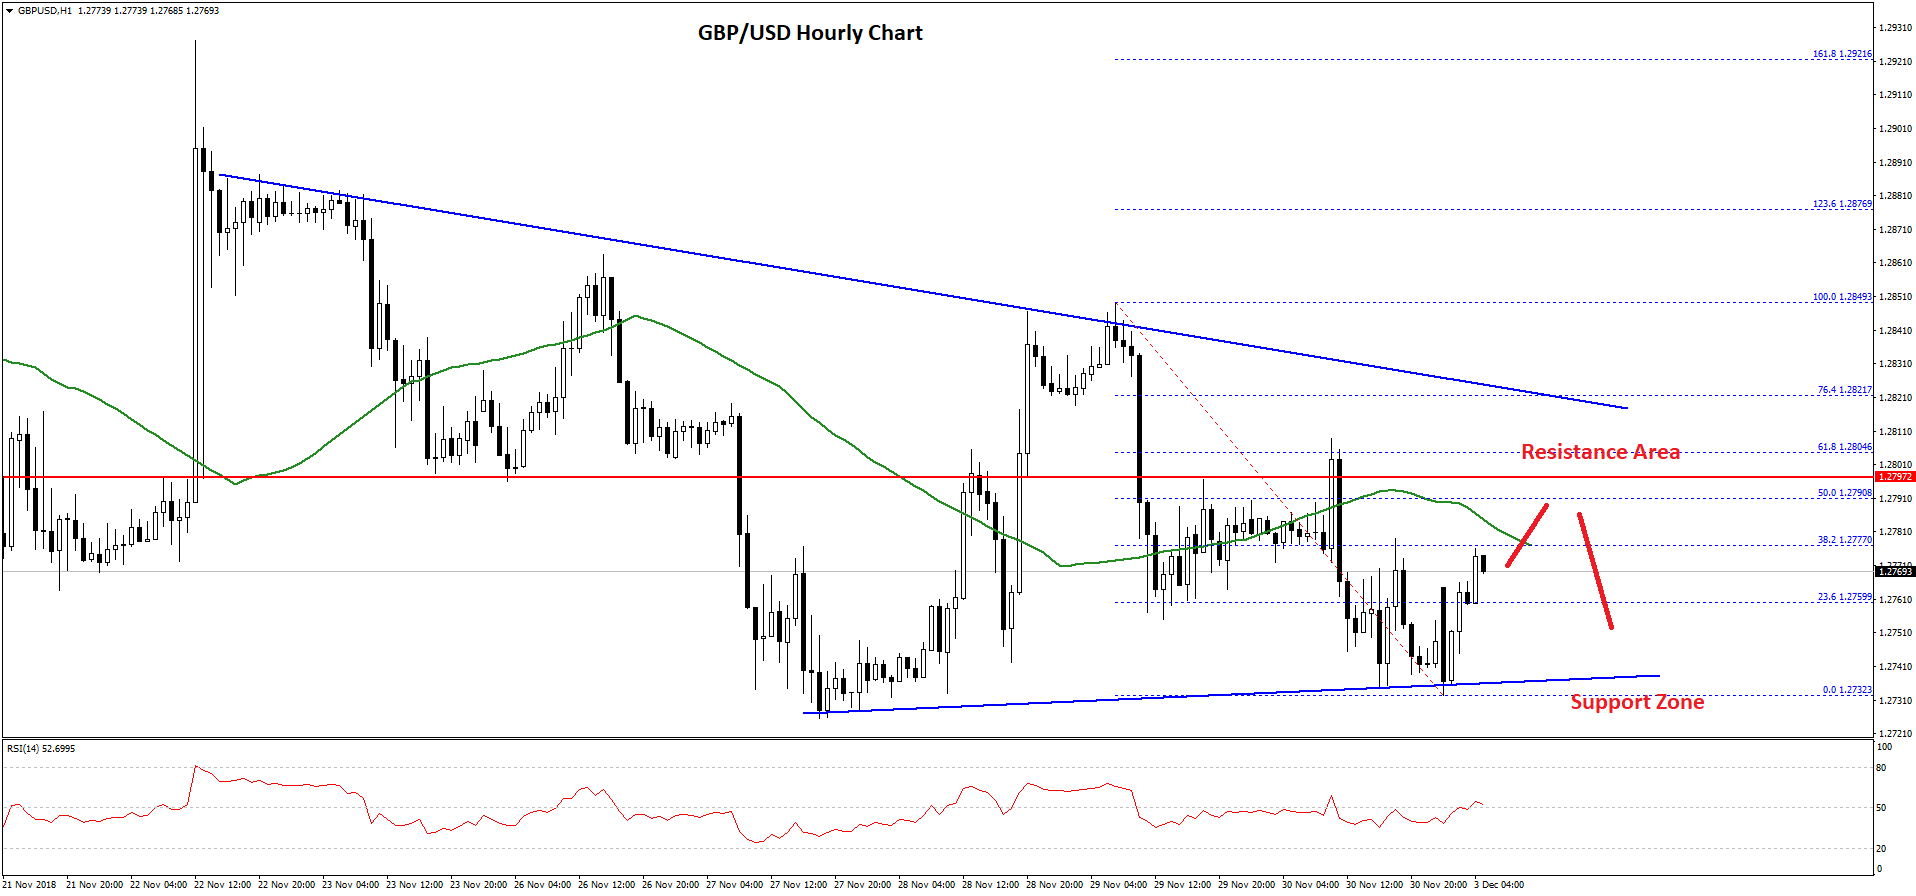
The recent swing low was 1.2732 and later the pair moved above the 23.6% Fib retracement level of the last slide from the 1.2849 high to 1.2732 low. However, there are many hurdles on the upside near the 1.2775 level and the 50 hourly SMA.
Above 1.2775, the next resistance is around 1.2795 and the 50% Fib retracement level of the last slide from the 1.2849 high to 1.2732 low. More importantly, there is a major bearish trend line in place with resistance at 1.2820 on the hourly chart.
Therefore, if the pair continues to move higher, it could find a lot of hurdles near the 1.2790 and 1.2820 levels. A successful close above 1.2820 may push the pair towards the next resistance at 1.2850.
On the downside, an initial support is at 1.2750 followed by the 1.2730 base. If there is a downside break below 1.2730, the pair could decline towards the 1.2660 support zone.
EUR/GBP Technical Analysis
The Euro remained in a major uptrend and it recently traded above the 0.8900 resistance area against the British Pound. The EUR/GBP pair traded towards the key 0.8920-30 resistance area where sellers emerged and protected more gains.
Later, the pair corrected lower and traded below the 0.8900 support area. There was a break below the 38.2% Fib retracement level of the last wave from the 0.8810 low to 0.8924 high. The pair even declined below the 0.8880 support level and the 50 hourly simple moving average.
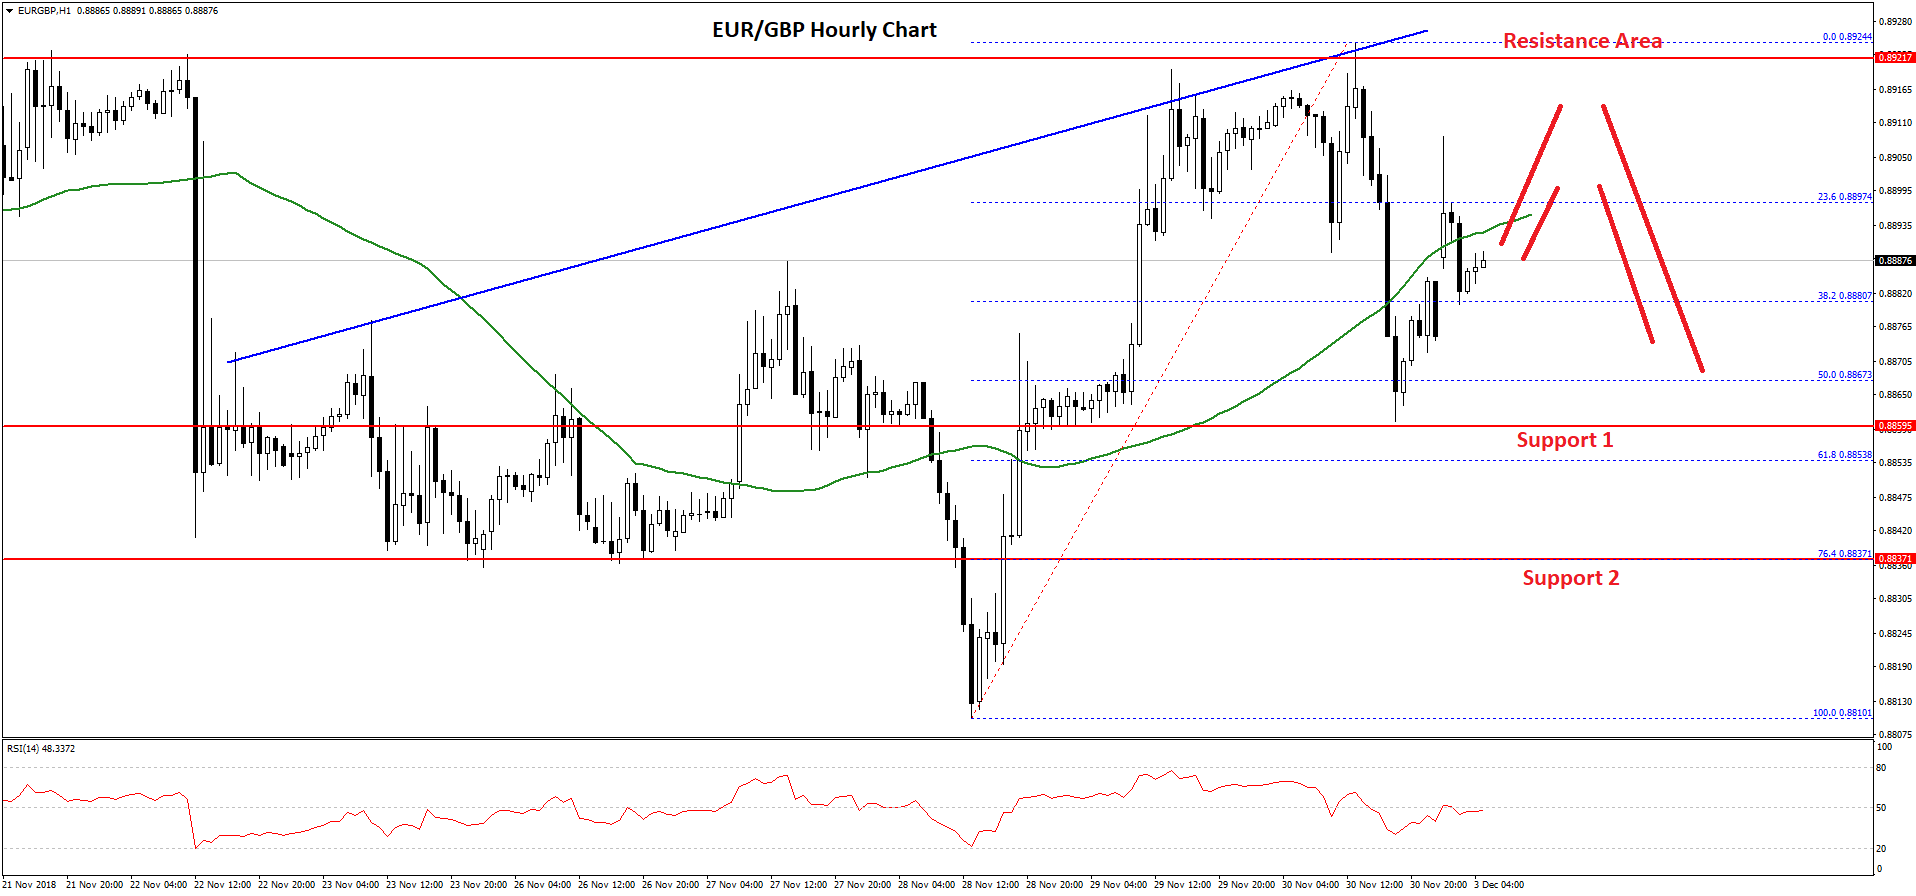
However, the decline was protected by the 0.8860 support and the 50% Fib retracement level of the last wave from the 0.8810 low to 0.8924 high.
Later, the pair bounced back and it is currently trading near the 0.8890 level. On the upside, an initial resistance is near 0.8900 and the 50 hourly SMA. Above this, the main hurdle is near a major resistance trend line in place with resistance at 0.8930 on the hourly chart.
A proper close above the 0.8930 resistance could accelerate gains towards the next key barrier at 0.9000. On the downside, the pair may continue to find support near the 0.8860 support. If sellers push EUR/GBP below 0.8860, the pair is likely to correct lower towards the 0.8840 or 0.8810 support.
Trade over 50 forex markets 24 hours a day with FXOpen. Take advantage of low commissions, deep liquidity, and spreads from 0.0 pips (additional fees may apply). Open your FXOpen account now or learn more about trading forex with FXOpen.
This article represents the opinion of the Companies operating under the FXOpen brand only. It is not to be construed as an offer, solicitation, or recommendation with respect to products and services provided by the Companies operating under the FXOpen brand, nor is it to be considered financial advice.
Stay ahead of the market!
Subscribe now to our mailing list and receive the latest market news and insights delivered directly to your inbox.


Latest articles

Pound at Key Levels: Markets Assess Impact of Political Uncertainty in the UK
The British pound remains under pressure following increased political uncertainty in the United Kingdom triggered by the Prime Minister’s resignation. Investors are assessing potential shifts in the political and economic policy outlook after the head of government stepped down,

Silver: Fed Tightens Its Tone as Price Returns to the Volume Profile Zone
Silver came under pressure following the Federal Reserve’s June meeting, at which policymakers kept interest rates unchanged at 3.50–3.75%. Nine of the 18 committee members still see the possibility of a rate increase this year, reinforcing

Ethereum: Market Assesses the Strength of the Corrective Recovery
Following a period of heightened volatility in early June, investor attention in Ethereum has once again shifted towards institutional demand and the development of the spot ETF market in the United States. The funds launched last year continue to serve