


FXOpen
GBP/USD started a fresh decline from well above the 1.3350 level. EUR/GBP is also declining and trading below the 0.8250 support zone.
Important Takeaways for GBP/USD and EUR/GBP
· The British Pound started a fresh decline from well above 1.3350 against the US Dollar.
· There was a break below a connecting bullish trend line with support near 1.3325 on the hourly chart of GBP/USD.
· EUR/GBP failed to stay above 0.8300 and started a fresh decline.
· There is a major bearish trend line forming with resistance near 0.8250 on the hourly chart.
GBP/USD Technical Analysis
The British Pound struggled to settle above the 1.3400 resistance zone against the US Dollar. The GBP/USD pair started a fresh decline below the 1.3350 support zone.
There was a clear move below the 1.3280 level and the 50 hourly simple moving average. The bears pushed the pair below the 1.3200 level. A low is formed near 1.3185 on FXOpen and the pair is now consolidating losses.
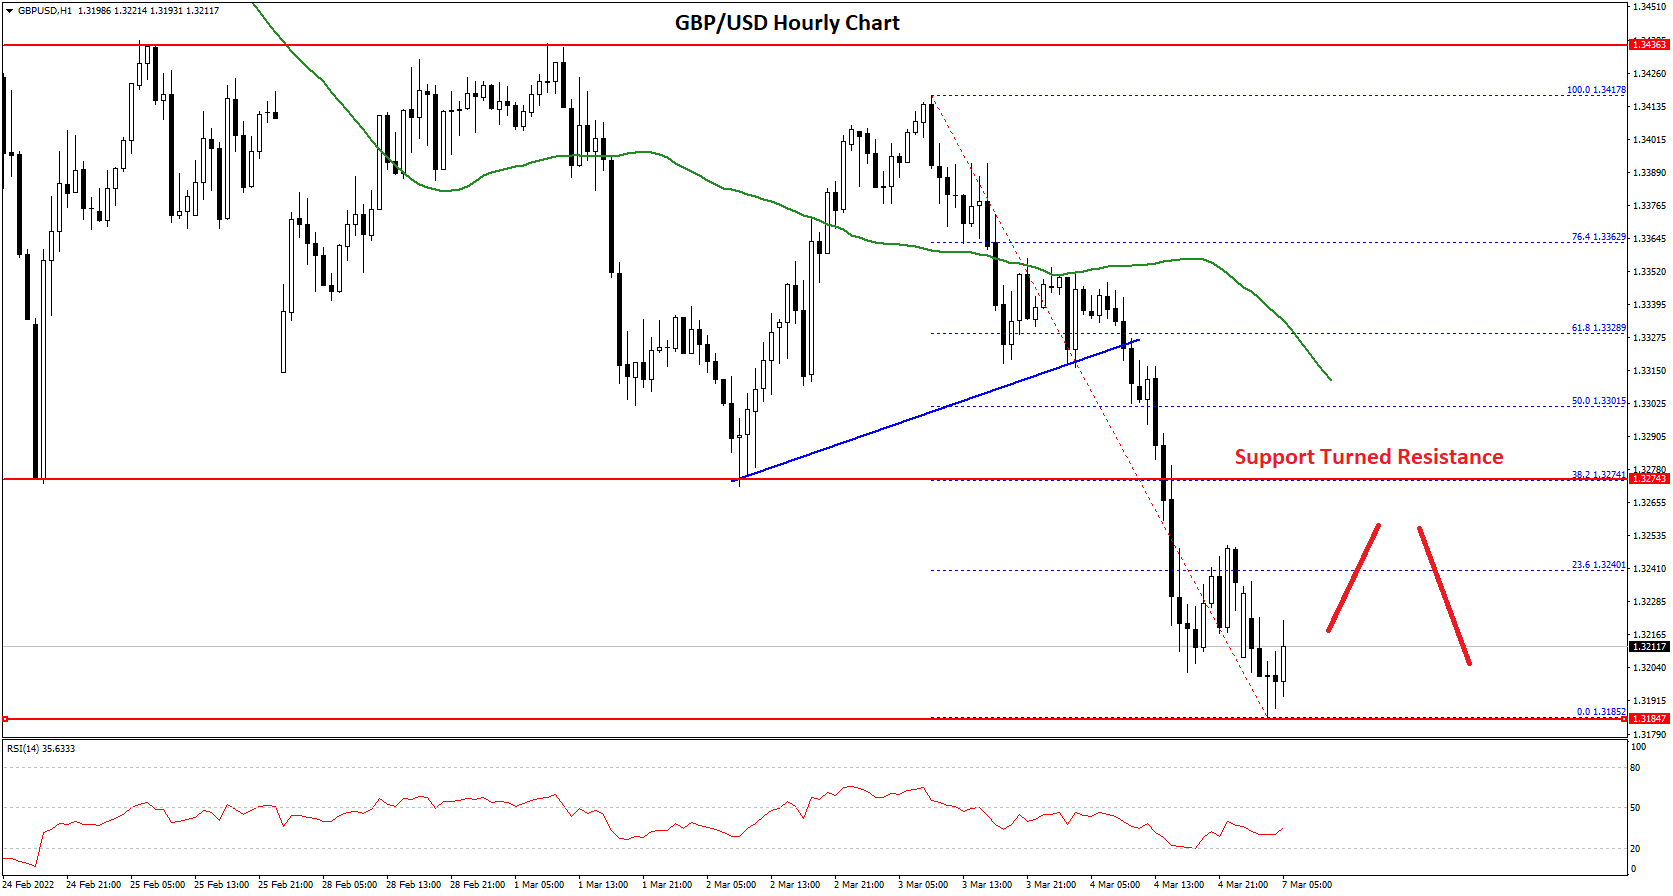
On the upside, an initial resistance is near the 1.3240 level. It is near the 23.6% Fib retracement level of the recent decline from the 1.3417 swing high to 1.3185 low.
The next main resistance is near the 1.3280 zone (the previous support). If there is an upside break above the 1.3280 resistance, the price could test 1.3300 or the 50 hourly simple moving average. It is near the 50% Fib retracement level of the recent decline from the 1.3417 swing high to 1.3185 low.
If there is no upside break, the pair could extend losses below the 1.3185 low. The first key support is near the 1.3150 level. Any more losses could lead the pair towards the 1.3120 support zone. The next major support sits near the 1.3050 level.
EUR/GBP Technical Analysis
The Euro struggled to clear the 0.8400 resistance zone against the British Pound. The EUR/GBP pair started a fresh decline and traded below the 0.8320 support zone.
There was a clear move below the 0.8250 level and the 50 hourly simple moving average. The pair traded below the 0.8220 level and formed a low near 0.8202. It is now consolidating losses and trading above the 23.6% Fib retracement level of the recent decline from the 0.8284 swing high to 0.8202 low.
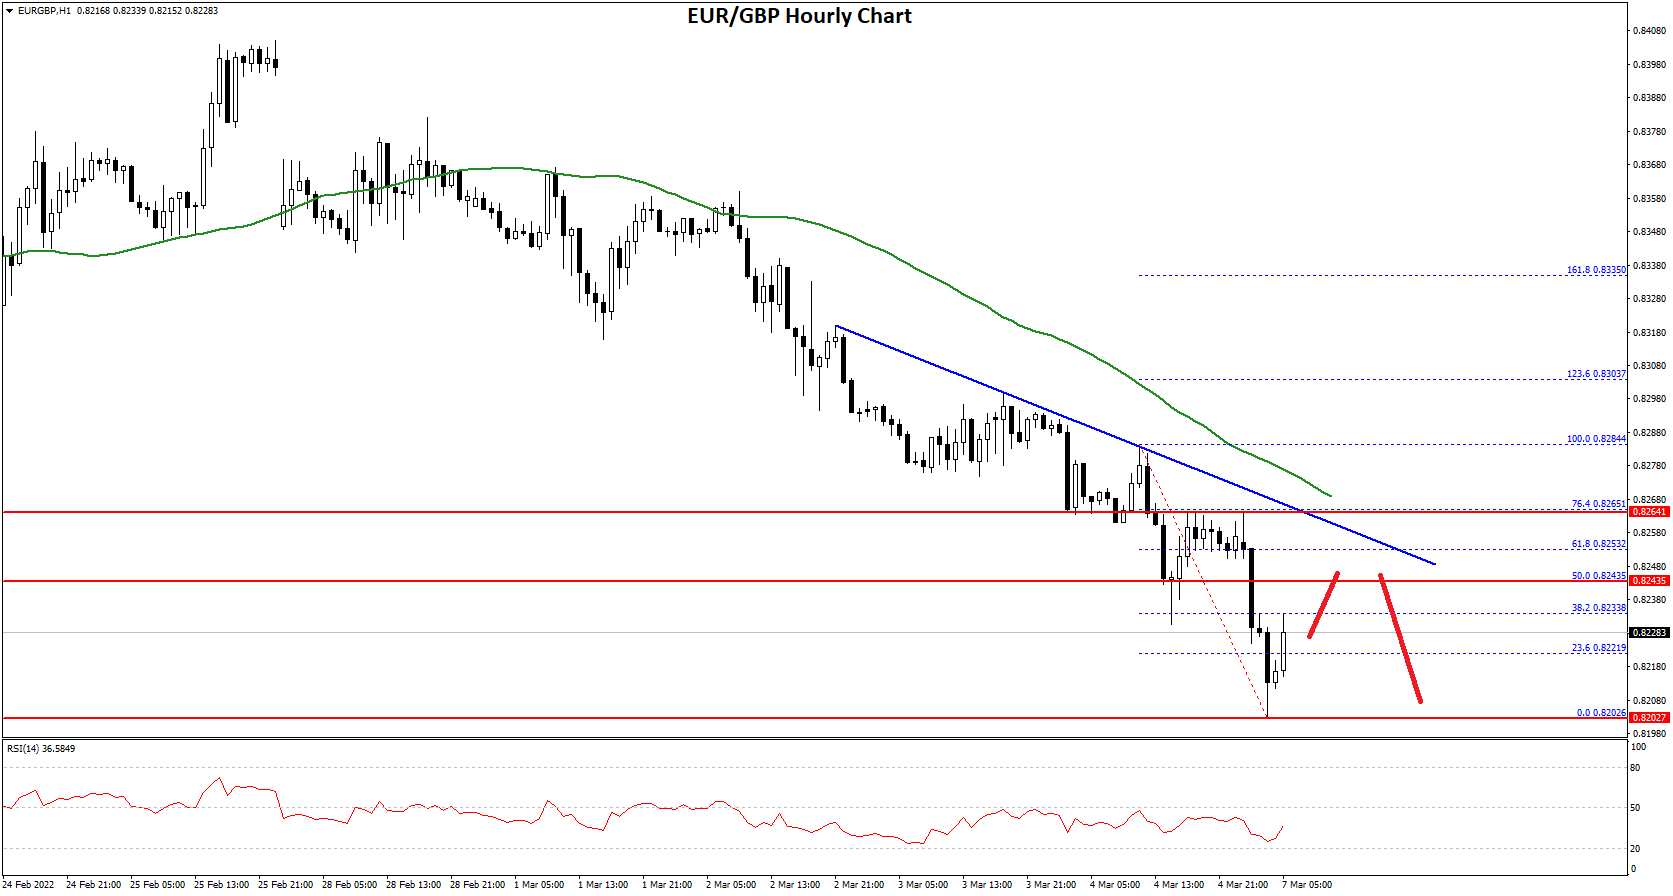
On the upside, the pair is facing resistance near the 0.8240 level. It is near the 50% Fib retracement level of the recent decline from the 0.8284 swing high to 0.8202 low.
There is also a major bearish trend line forming with resistance near 0.8250 on the hourly chart. The next major resistance for the bulls is near the 0.8265 level. A clear move above the 0.8265 resistance might push the price higher.
The next main resistance on the upside is near the 0.8300 level. If there is no recovery wave, the pair could move down below 0.8200.
On the downside, an initial support is near the 0.8185 level. The next major support is near 0.8150 level. A downside break below the 0.8155 and 0.8150 support levels might call for more downsides. In the stated case, the pair could decline towards the 0.8100 support level in the near term.
This forecast represents FXOpen Markets Limited opinion only, it should not be construed as an offer, invitation or recommendation in respect to FXOpen Markets Limited products and services or as financial advice.
Trade over 50 forex markets 24 hours a day with FXOpen. Take advantage of low commissions, deep liquidity, and spreads from 0.0 pips (additional fees may apply). Open your FXOpen account now or learn more about trading forex with FXOpen.
This article represents the opinion of the Companies operating under the FXOpen brand only. It is not to be construed as an offer, solicitation, or recommendation with respect to products and services provided by the Companies operating under the FXOpen brand, nor is it to be considered financial advice.
Stay ahead of the market!
Subscribe now to our mailing list and receive the latest market news and insights delivered directly to your inbox.


Latest articles


XAG/USD Analysis: Silver Drops to March Low
As seen on the XAG/USD chart, the price of silver fell to the $70 level and briefly pierced it, marking the lowest level since early February.
Although geopolitical tensions typically support demand for safe-haven assets, silver is under pressure

XBR/USD Analysis: Brent Crude Rises Above $110
Yesterday, Brent crude prices moved sharply higher, with the XBR/USD chart showing breakouts above local resistance levels. Today, the price has climbed above the $110 mark, bringing it close to the multi-year high recorded on 9 March.
The bullish