GBP/USD and EUR/GBP Could Extend Declines
GBP/USD broke the 1.3100 support and is currently consolidating above 1.3000. EUR/GBP is following a downtrend and it could extend losses towards the 0.8850 support.
Important Takeaways for GBP/USD and EUR/GBP
- The British Pound declined recently and broke the 1.3100 and 1.3060 support levels.
- There is a key bearish trend line in place with resistance at 1.3055 on the hourly chart of GBP/USD.
- EUR/GBP is following a major declining channel with resistance at 0.8900 on the hourly chart.
- There could be more losses towards 0.8850 as long as the pair is below 0.8900.
GBP/USD Technical Analysis
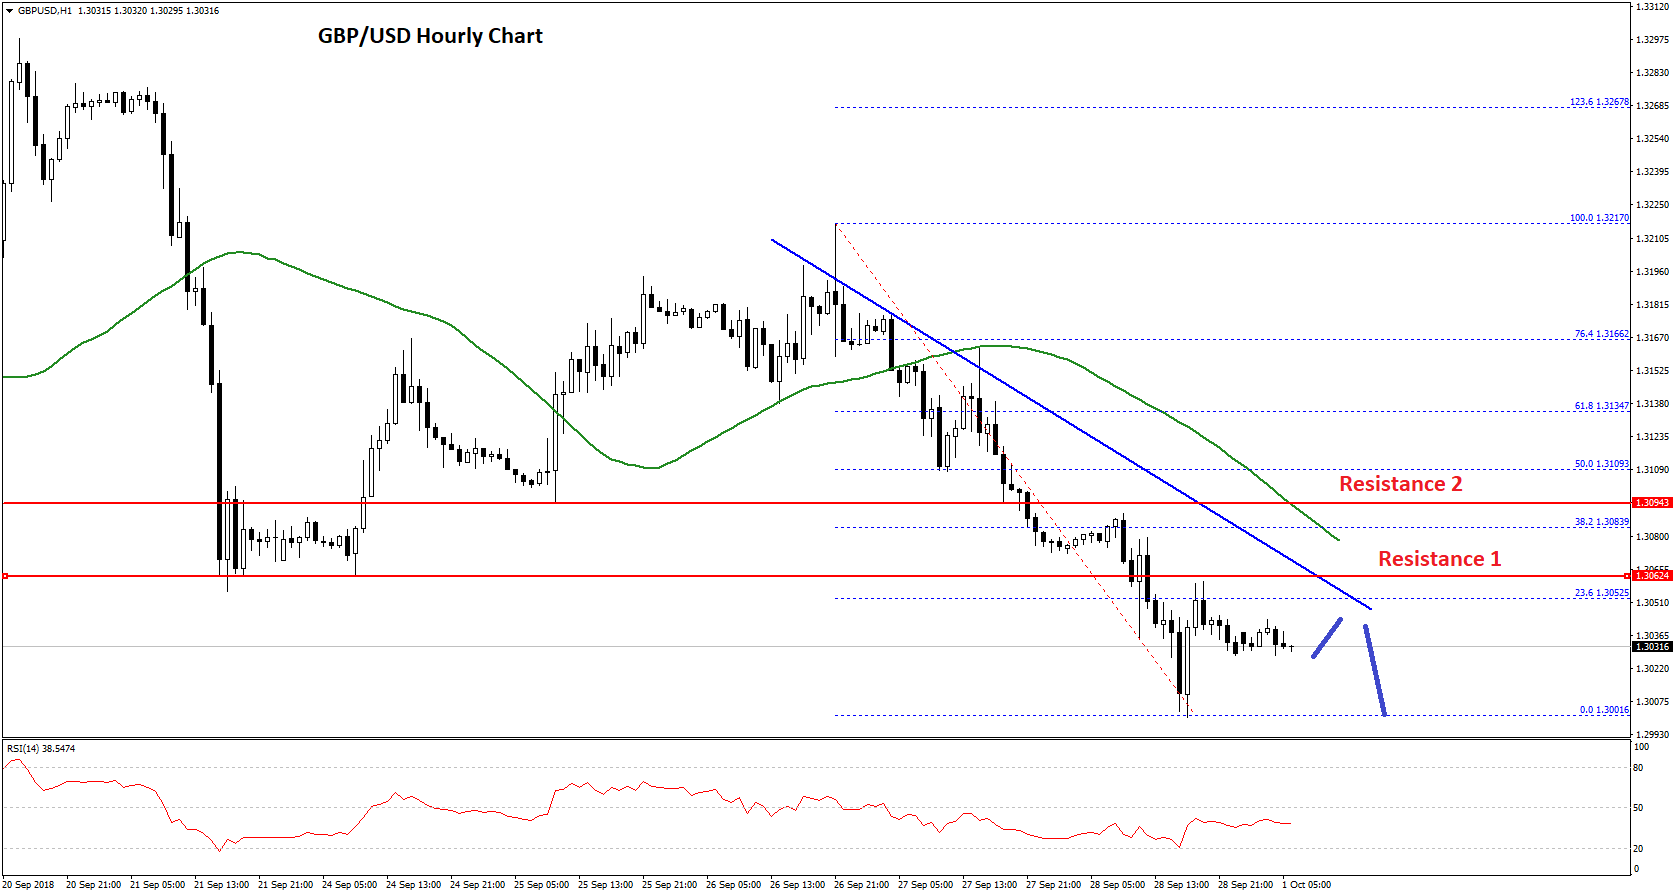
The British Pound failed to hold gains above the 1.3200-1.3210 zone against the US Dollar. The GBP/USD pair started a downside move and broke a few important supports like 1.3150 and 1.3100.
The decline was strong as the pair even broke the 1.3060 support and settled below the 50 hourly simple moving average. It traded close to the 1.3000 level and formed a low at 1.3001. Later, the pair corrected higher and tested the 1.3060 resistance.
The pair also tested the 23.6% Fib retracement level of the last decline from the 1.3217 high to 1.3001 low, which acted as a major resistance. More importantly, there is a key bearish trend line in place with resistance at 1.3055 on the hourly chart.
Above the trend line, the next key hurdle for buyers is near the 1.3080 level and the 50 hourly SMA. The most important resistance is the 50% Fib retracement level of the last decline from the 1.3217 high to 1.3001 low at 1.3109.
Above 1.3109, the pair could gain traction towards the 1.3200 and 1.3220 resistance levels. On the other hand, a downside break below the 1.3000 support zone will most likely accelerate losses in the near term.
Overall, the pair remains at a risk of more losses as long as it is trading below the 1.3100 resistance and the 50 hourly SMA.
EUR/GBP Technical Analysis
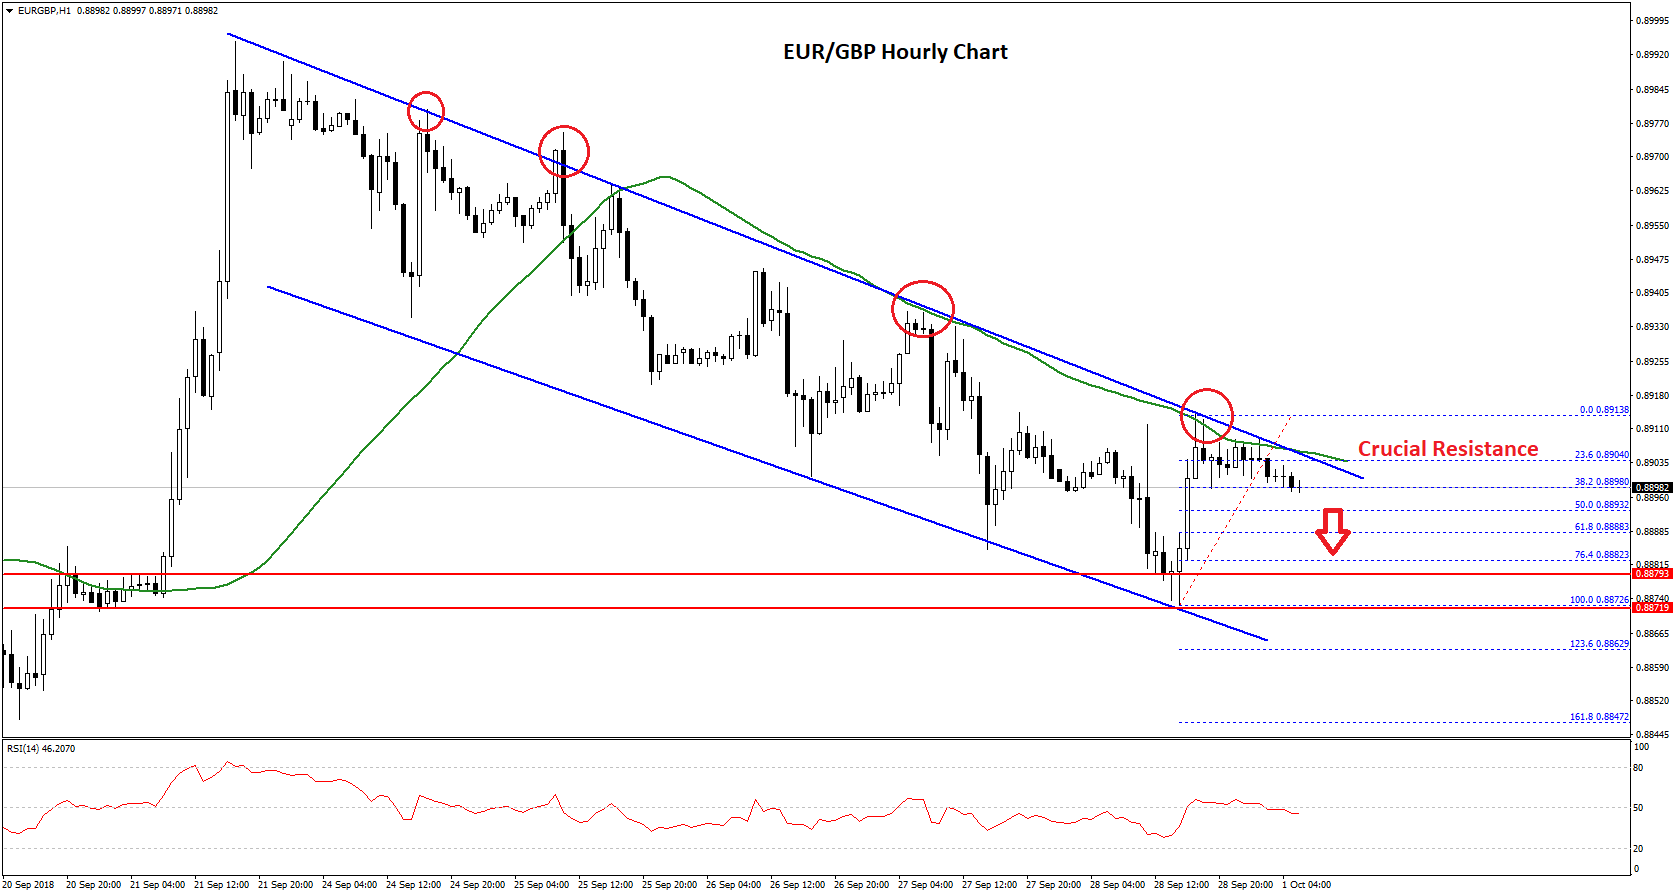
The Euro traded close to the 0.9000 resistance against the British Pound. The EUR/GBP pair failed to break the 0.9000 resistance and started a downside move.
There were slow and steady losses in EUR/GBP and the pair broke the 0.8960 and 0.8920 support levels. There was even a close below the 0.8920 support and the 50 hourly simple moving average.
It seems like sellers are in control as the pair is following a major declining channel with resistance at 0.8900 on the hourly chart. The recent low was 0.8876 before the pair corrected higher to 0.8910-0.8915.
Buyers failed to push the pair above the channel resistance and the 50 hourly SMA. Therefore, there are chances of a fresh decline towards the 0.8870 level. The pair has breached the 23.6% Fib retracement level of the last wave from the 0.8872 low to 0.8913 high.
If there is a break below the 0.8895 level, there could be more declines towards the last swing low at 0.8872. An intermediate support is at 0.8888 and the 61.8% Fib retracement level of the last wave from the 0.8872 low to 0.8913 high.
Below the recent low of 0.8872, the pair may perhaps decline towards the next support at 0.8850. On the flip side, buyers need to push the pair above the channel resistance, 0.8920, and the 50 hourly SMA to gain bullish momentum in the near term.