


GBP/USD and EUR/GBP: Pound Extending Losses
FXOpen
GBP/USD declined heavily this past week and broke the key 1.3100 support area. EUR/GBP gained traction and broke the 0.8580 and 0.8600 resistance levels to move into a positive zone.
Important Takeaways for GBP/USD and EUR/GBP
- The British Pound faced an increase in selling pressure and tumbled below 1.3100.
- There is a major bearish trend line in place with resistance at 1.3110 on the hourly chart of GBP/USD.
- EUR/GBP climbed higher recently and traded above the 0.8600 resistance level.
- There was a break above a key bearish trend line at 0.8610 on the hourly chart.
GBP/USD Technical Analysis
The British Pound faced a strong resistance above the 1.3340 level against the US Dollar. The GBP/USD pair started a significant downside move and broke the 1.3300 and 1.3200 support levels.
The decline was strong as the pair even broke the 1.3100 pivot level and the 50 hourly simple moving average. Sellers even succeeded in clearing the 1.3060 and 1.3020 support levels. This week, the pair opened with a gap down below 1.3000 and traded as low as 1.2960 on FXOpen.
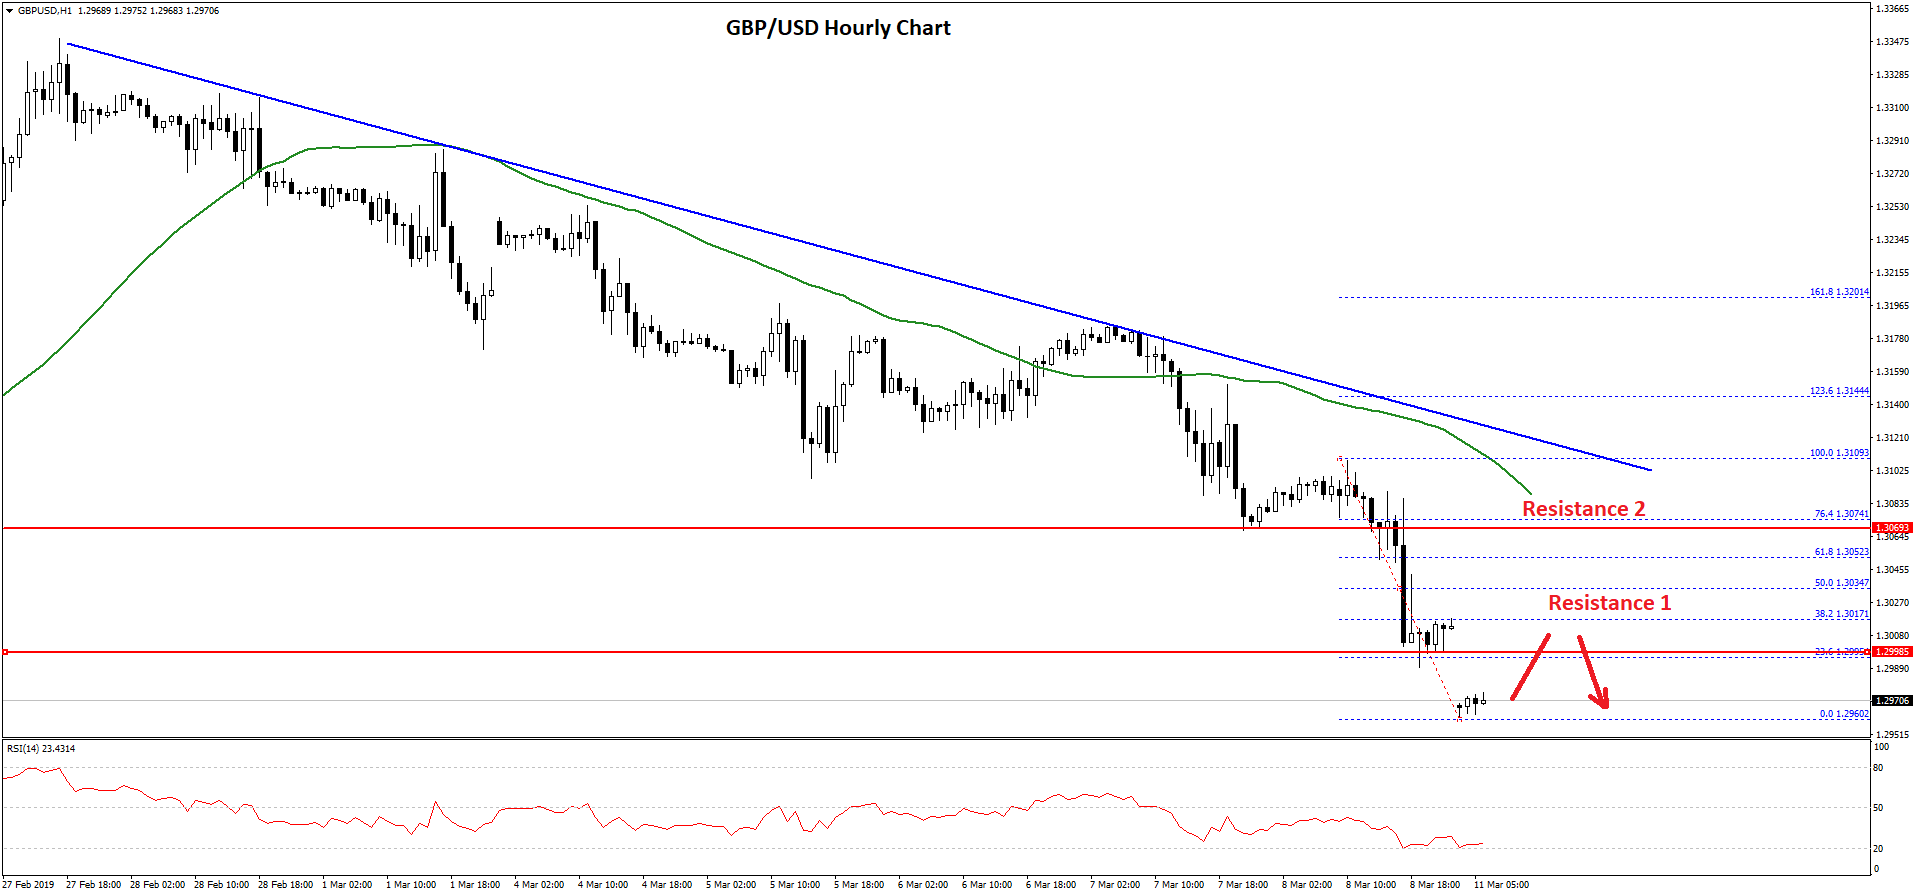
The pair is currently consolidating losses below 1.2980, with an initial resistance near the 1.3000 level and the 23.6% fib retracement level of the recent decline from the 1.3109 high to 1.2960 low.
On the upside, there are many resistances near the 1.3000, 1.3020 and 1.3050 levels. The 50% fib retracement level of the recent decline from the 1.3109 high to 1.2960 low is also near the 1.3035 level.
Moreover, there is a major bearish trend line in place with resistance at 1.3110 on the hourly chart of GBP/USD. Therefore, if the pair corrects higher, it is likely to face sellers near the 1.3020 and 1.3050 levels.
On the downside, an initial support is near the 1.2960 low. If there are more losses, the pair could tumble towards the 1.2920 and 1.2900 support levels in the near term.
EUR/GBP Technical Analysis
The Euro gained traction above the 0.8580 resistance levels against the British Pound. The EUR/GBP pair climbed higher and broke the 0.8600 and 0.8605 resistance levels to move into a positive zone.
The recent upward move was strong as there was a close above the 0.8620 level and the 50 hourly simple moving average. During the rise, there was a break above a key bearish trend line at 0.8610 on the hourly chart.
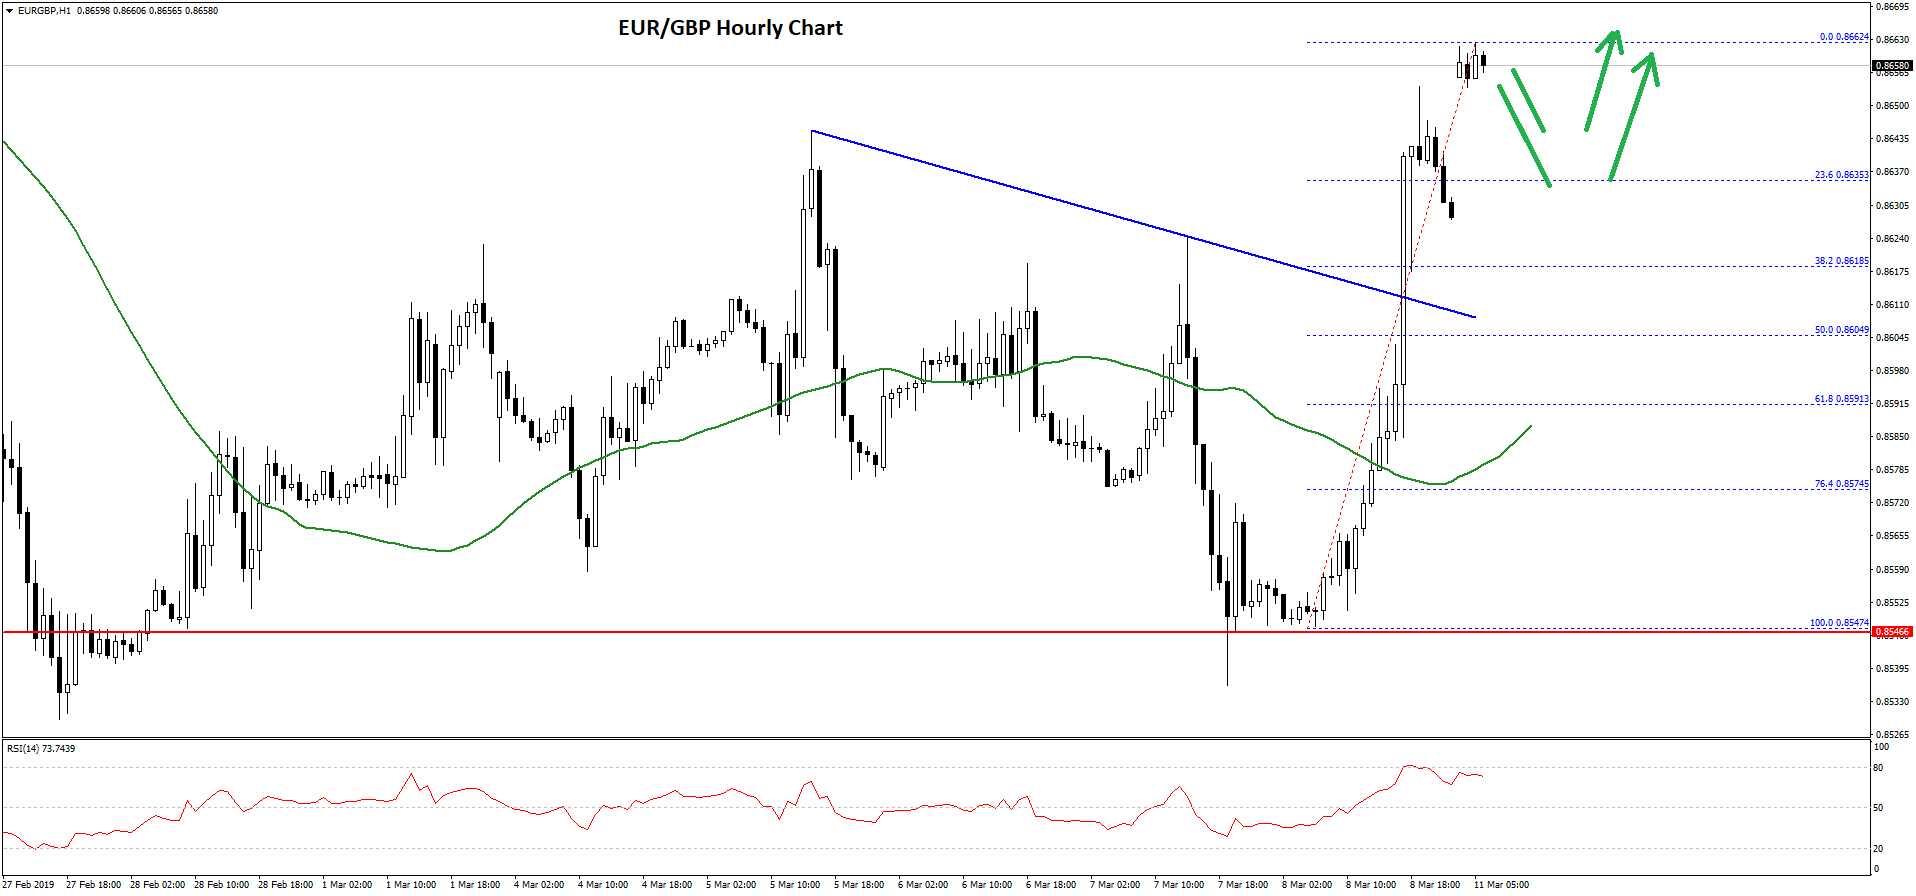
The pair recently traded above 0.8640 and opened with a gap up to 0.8662. At the moment, the pair is correcting gains towards the 0.8650 level. The main support is near the 0.8635 level and the 23.6% Fib retracement level of the recent wave from the 0.8547 low to 0.8662 high.
If there are more losses, the pair could revisit the 0.8620 support level, where buyers are likely to emerge. On the upside, the pair could trade above the 0.8665 and 0.8670 resistance levels. The next key resistance is near the 0.8700 level.
Overall, the British Pound is facing a strong selling interest, but there are chances of a short term recovery, especially to fill the recent gap in GBP/USD and EUR/GBP. However, any major recovery is likely to remain capped in the coming days.
Trade over 50 forex markets 24 hours a day with FXOpen. Take advantage of low commissions, deep liquidity, and spreads from 0.0 pips (additional fees may apply). Open your FXOpen account now or learn more about trading forex with FXOpen.
This article represents the opinion of the Companies operating under the FXOpen brand only. It is not to be construed as an offer, solicitation, or recommendation with respect to products and services provided by the Companies operating under the FXOpen brand, nor is it to be considered financial advice.
Stay ahead of the market!
Subscribe now to our mailing list and receive the latest market news and insights delivered directly to your inbox.


Latest articles

EUR/USD Eyes Gains As USD/CHF Weakness Deepens Again
EUR/USD started a fresh increase above 1.1700 and 1.1720. USD/CHF declined further and is now struggling below 0.7835.
Important Takeaways for EUR/USD and USD/CHF Analysis Today
· The Euro started a decent increase from

Apple: Earnings Day Above the Activity Zone
On 30 April, after the market close, Apple Inc. will release its financial results for the second quarter of fiscal 2026. The consensus forecast, based on estimates from 31 analysts, points to revenue of around $109.7 billion, with expected

USD/JPY and USD/CHF Near Key Levels: The Dollar Supported by the Fed
The US dollar continues to trend upwards following the Federal Reserve meeting, drawing support from the regulator’s moderately hawkish stance and comments by Jerome Powell. Markets interpret the Fed’s rhetoric as a signal that restrictive policy is likely