


FXOpen

GBP/USD started a fresh decline and tested the 1.3680 support. EUR/GBP is rising, but it must stay above the 0.8440 support zone to continue higher.
Important Takeaways for GBP/USD and EUR/GBP
· The British Pound failed to gain pace above the 1.3800 and 1.3830 resistance levels.
· There was a break below a major contracting triangle with support near 1.3760 on the hourly chart of GBP/USD.
· EUR/GBP corrected lower from the 0.8475 resistance zone and declined below 0.8460.
· There is a major bullish trend line forming with support 0.8440 on the hourly chart.
GBP/USD Technical Analysis
The British Pound attempted a key upside break above 1.3820 against the US Dollar. The GBP/USD pair failed to gain momentum and started a fresh decline below 1.3750.
The pair broke the 1.3720 support zone and the 50 hourly simple moving average. There was also a break below a major contracting triangle with support near 1.3760 on the hourly chart of GBP/USD.
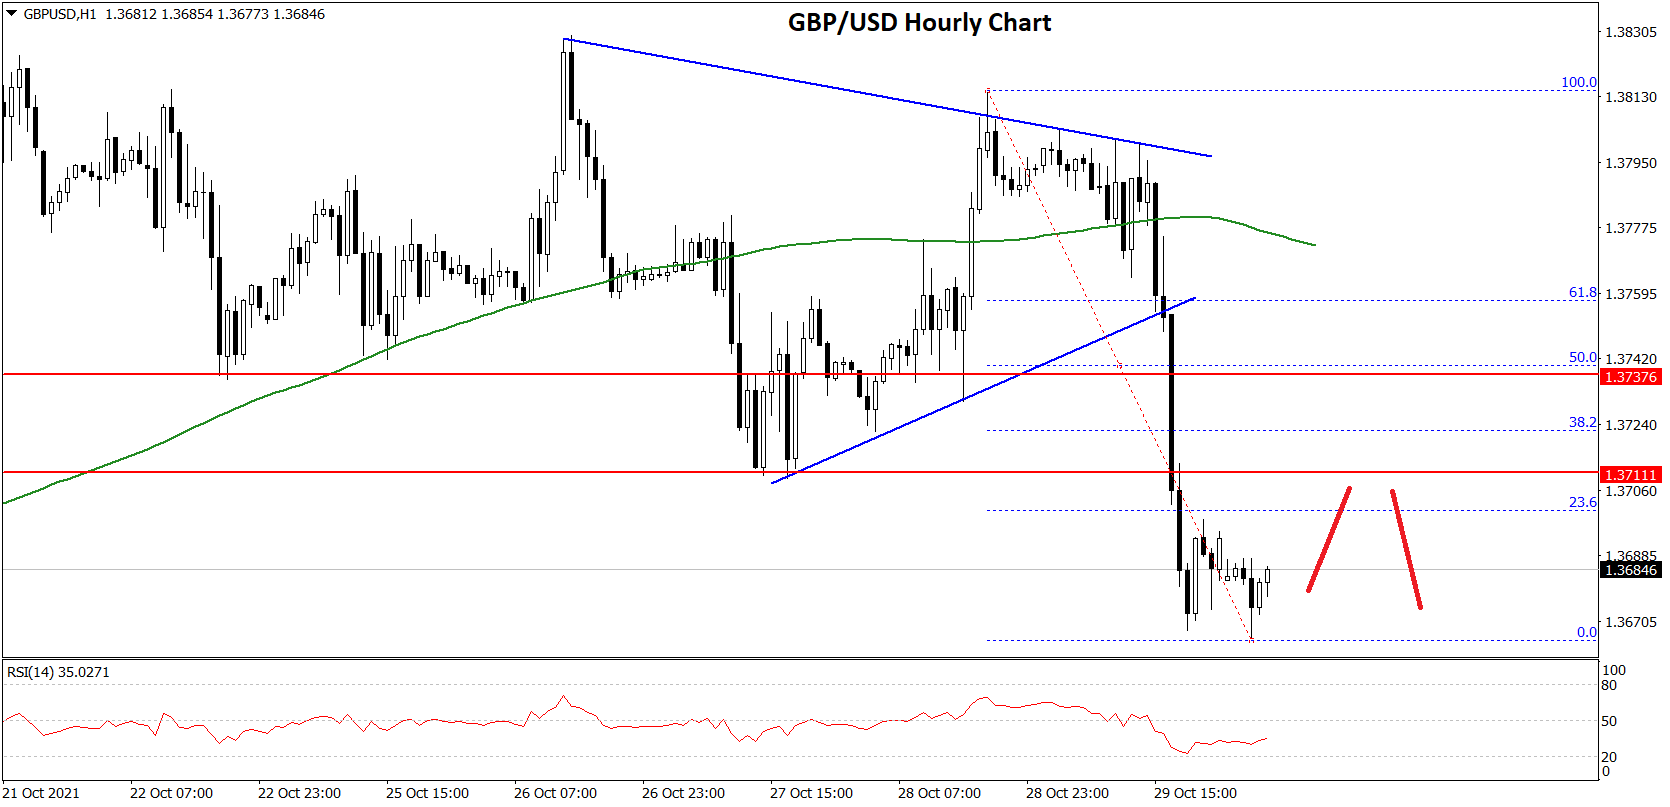
The pair spiked below 1.3700 and traded as low as 1.3665. It is now consolidating losses above the 1.3665 level. On the upside, the pair is facing resistance near 1.3700. It is near the 23.6% Fib retracement level of the downward move from the 1.3814 swing high to 1.3665 low.
If there is an upside break above the 1.3700 resistance, the price could surpass 1.3720. The next main resistance is near the 1.3740 zone. It is close to the 50% Fib retracement level of the downward move from the 1.3814 swing high to 1.3665 low.
Any more gains could send the pair towards the 1.3800 level in the near term. An immediate support is near the 1.3665 level. A downside break below the 1.3665 support might even push the pair below the 1.3650 support zone.
The next major support is near the 1.3600 level. Any more downsides might call for a move towards the 1.3550 level.
EUR/GBP Technical Analysis
The Euro started a strong increase after it formed a base above 0.8400 against the British Pound. The EUR/GBP pair surpassed the 0.8450 level to move into a positive zone.
The pair settled above the 0.8450 zone and the 50 hourly simple moving average. A high was formed near 0.8475 before the pair started a downside correction. It broke the 0.8460 level, but it is stable above the 0.8440 level.
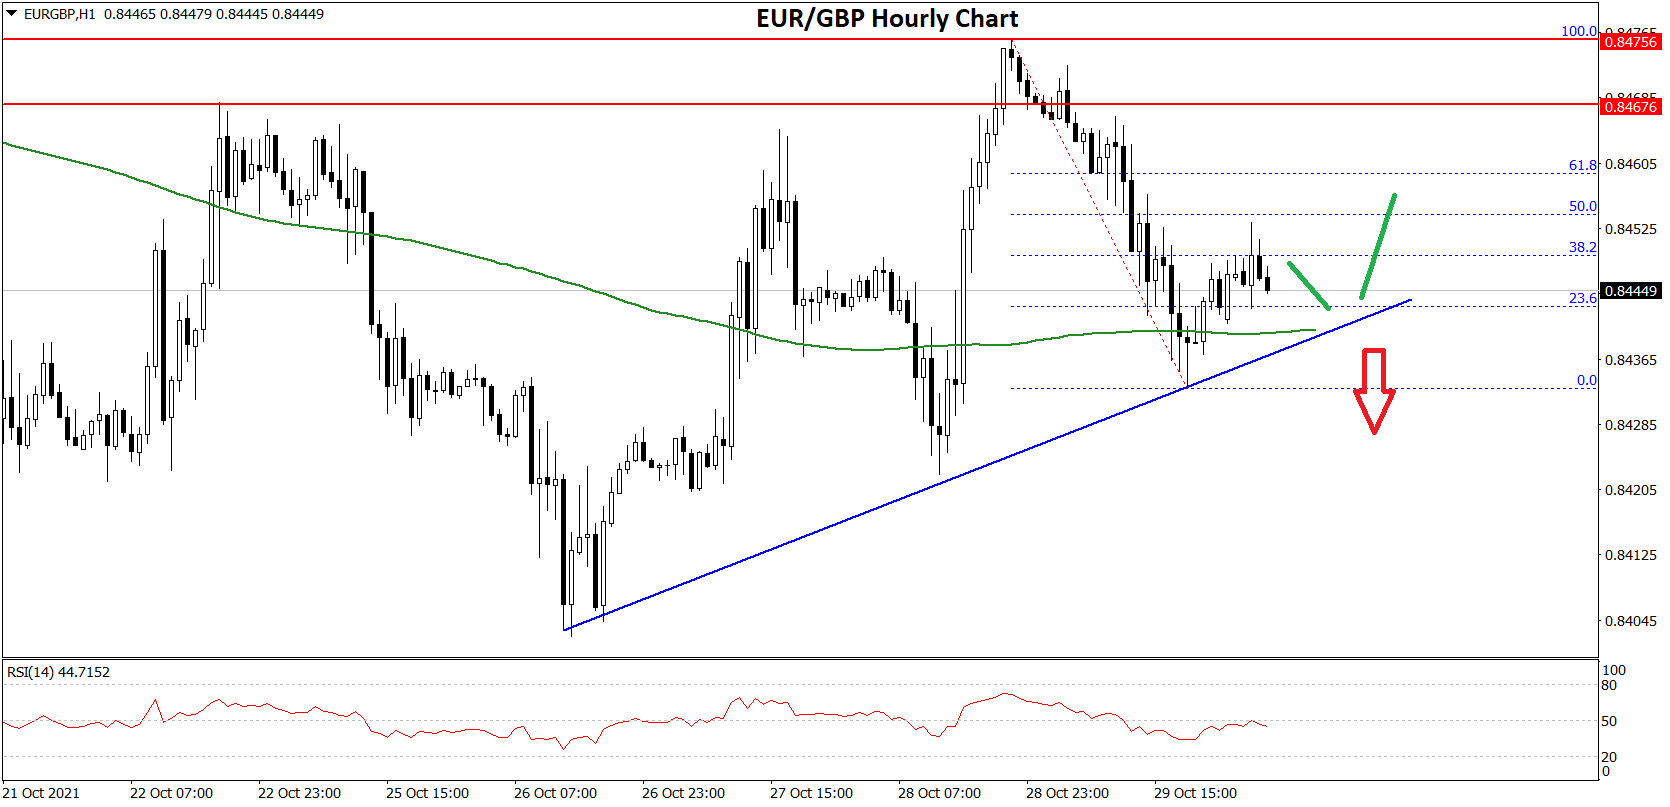
An immediate resistance is near the 0.8455 level. It is near the 50% Fib retracement level of the downward move from the 0.8475 swing high to 0.8432 low.
A clear break above the 0.8455 level may possibly lift the pair towards the 0.8465 resistance. It is close to the 76.4% Fib retracement level of the downward move from the 0.8475 swing high to 0.8432 low. The next major stop for the bulls could be 0.8500.
An initial support on the downside is near the 0.8440 level. There is also a major bullish trend line forming with support 0.8440 on the hourly chart.
The next major support is near 0.8435 level. A downside break below the 0.8440 and 0.8435 support levels might call for more downsides. In the stated case, the pair could decline towards the 0.8400 support level in the near term.
This forecast represents FXOpen Markets Limited opinion only, it should not be construed as an offer, invitation or recommendation in respect to FXOpen Markets Limited products and services or as financial advice.
This article represents the opinion of the Companies operating under the FXOpen brand only. It is not to be construed as an offer, solicitation, or recommendation with respect to products and services provided by the Companies operating under the FXOpen brand, nor is it to be considered financial advice.
Stay ahead of the market!
Subscribe now to our mailing list and receive the latest market news and insights delivered directly to your inbox.

Latest articles

Weak Data Weigh on the Dollar: Market Awaits Trend Confirmation
The US dollar is retreating from recent highs, moving into a moderate correction after a prolonged period of gains. Pressure on the currency is building amid weaker-than-expected macroeconomic data, while market participants adopt a wait-and-see approach ahead of key labour

Market Analysis: EUR/USD Aims Recovery While USD/JPY Gives Back Recent Gains
EUR/USD is recovering losses from 1.1450. USD/JPY is correcting gains from 160.50 and might decline further below 158.00.
Important Takeaways for EUR/USD and USD/JPY Analysis Today
· The Euro struggled to stay in a

European Currencies Decline: Pound Hits New Lows, Euro Under Pressure
European currencies continue to weaken against the US dollar amid rising geopolitical tensions and increased demand for safe-haven and liquid assets. Market participants are reducing exposure to riskier instruments, putting pressure on both the euro and the pound. Additional support