


FXOpen

GBP/USD gained strength above 1.3600, but it struggled to continue higher above 1.3700. GBP/JPY also corrected lower after forming a short-term top near 142.25.
Important Takeaways for GBP/USD and GBP/JPY
- The British Pound tested the 1.3700 resistance zone before correcting lower.
- There was a break below an ascending channel with support near 1.3638 on the hourly chart of GBP/USD.
- GBP/JPY also corrected lower from 142.25 and declined below 141.50.
- There was a break below a major bullish trend line with support near 141.20 on the hourly chart.
GBP/USD Technical Analysis
This past week, the British Pound saw a steady increase above the 1.3550 resistance against the US Dollar. The GBP/USD pair even broke the 1.3600 resistance zone to move further into a positive zone.
The pair climbed above the 1.3650 and 1.3680 resistance levels, but it struggled to gain momentum above 1.3700. A high was formed near 1.3710 on FXOpen and the pair recently started a downside correction.
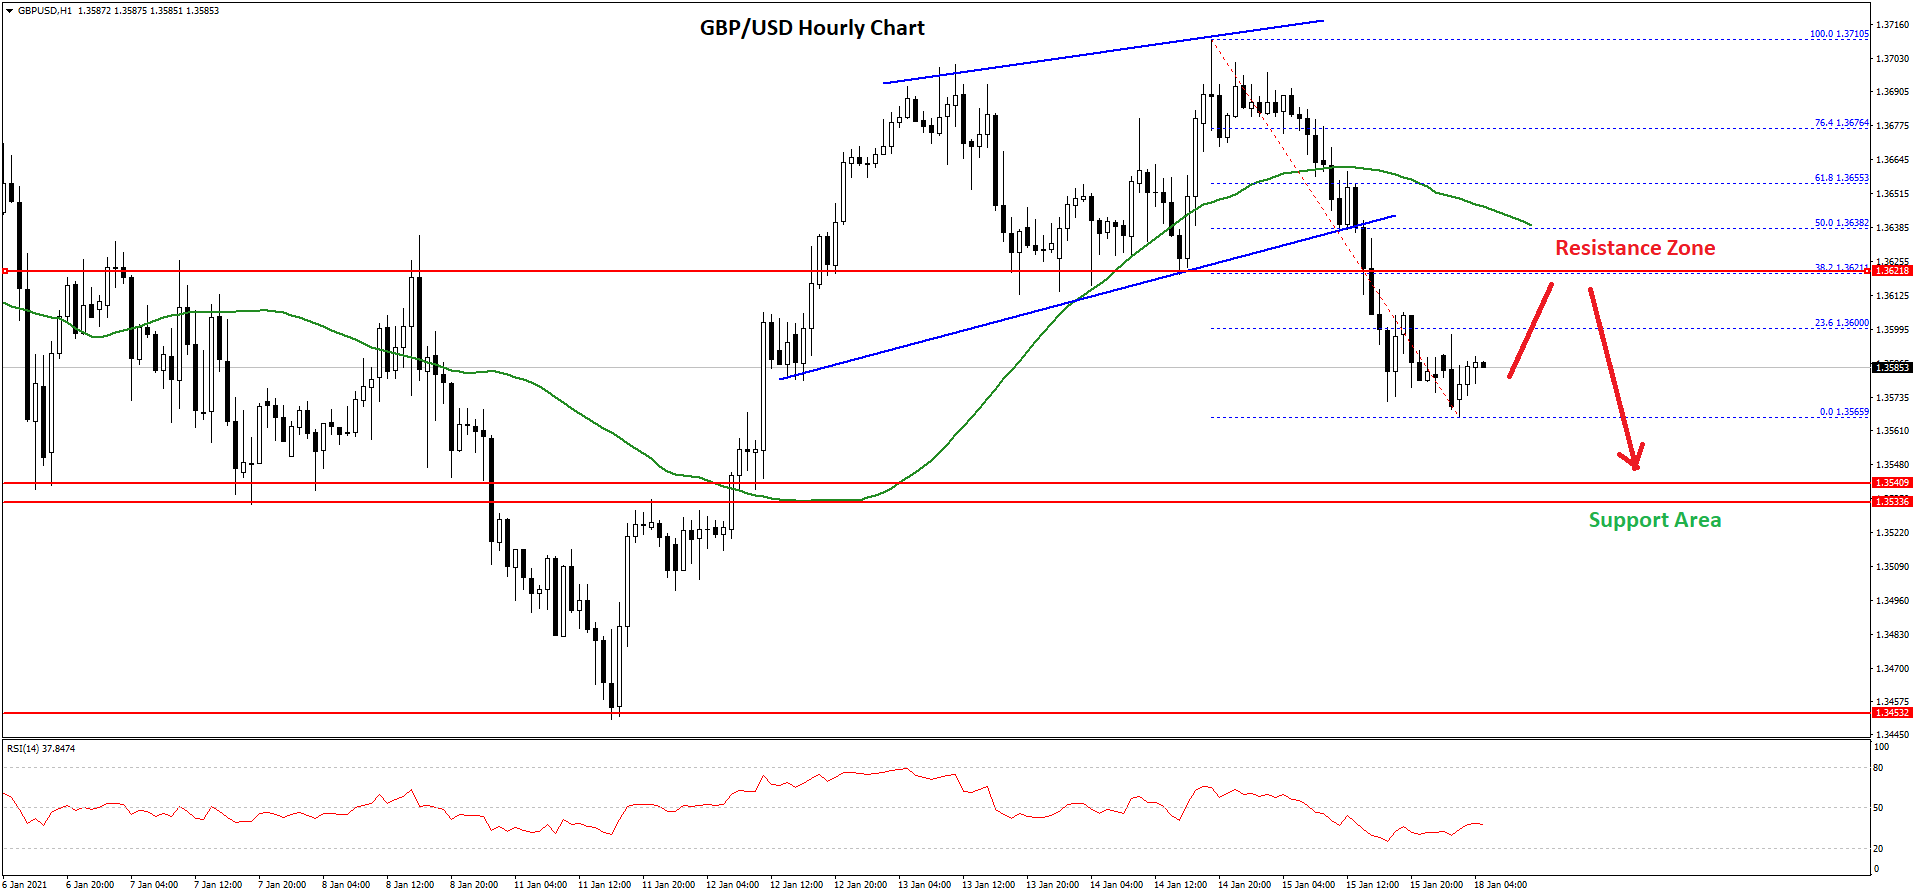
There was a break below the 1.3650 and 1.3620 support levels. There was also a close below the 1.3620 level and the 50 hourly simple moving average. Moreover, there was a break below an ascending channel with support near 1.3638 on the hourly chart of GBP/USD.
The pair traded as low as 1.3565 and it is currently consolidating losses. An initial resistance on the upside is near the 1.3600 zone. It is close to the 23.6% Fib retracement level of the recent decline from the 1.3710 high to 1.3565 low.
The first key resistance is forming near the 1.3620 level. The next major resistance is near the 1.3640 level and the 50 hourly simple moving average. It is close to the 50% Fib retracement level of the recent decline from the 1.3710 high to 1.3565 low.
If there is an upside break above 1.3620 and 1.3640, GBP/USD could easily drift towards the 1.3700 zone. On the downside, the 1.3565 level is a decent support. If there is a downside break below the recent low, the pair could continue to move down towards the 1.3500 support level in the near term.
GBP/JPY Technical Analysis
The British Pound formed a short-term top near the 142.25 before it started a downside correction against the Japanese Yen. The GBP/JPY pair traded below the 141.80 support level to start the recent decline.
There was a clear break below the 141.50 support level and the 50 hourly simple moving average. There was also a break below a major bullish trend line with support near 141.20 on the hourly chart. The pair cleared the 50% Fib retracement level of the upward move from the 140.34 low to 142.25 high.

It is now trading well below the 141.20 level. It is testing the 76.4% Fib retracement level of the upward move from the 140.34 low to 142.25 high.
The next major support is near the 140.60 level, below which the pair could dive towards the 140.00 support zone in the coming sessions. On the upside, the previous support near 141.30 might act as a resistance.
The first major resistance is near the 141.50 level and the 50 hourly simple moving average. If GBP/JPY climbs above 141.30 and 141.50, it could revisit the 142.25 zone in the coming sessions.
Trade over 50 forex markets 24 hours a day with FXOpen. Take advantage of low commissions, deep liquidity, and spreads from 0.0 pips. Open your FXOpen account now or learn more about trading forex with FXOpen.
This article represents the opinion of the Companies operating under the FXOpen brand only. It is not to be construed as an offer, solicitation, or recommendation with respect to products and services provided by the Companies operating under the FXOpen brand, nor is it to be considered financial advice.
Stay ahead of the market!
Subscribe now to our mailing list and receive the latest market news and insights delivered directly to your inbox.


Latest articles

S&P 500 Index: Chart Analysis After Friday’s Sell-Off
Trading on 12 December was overshadowed by a sharp decline in the S&P 500 (US SPX 500 mini on FXOpen), with the session low approaching December’s previous trough.
Among the key fundamental drivers behind Friday’s drop

Market Analysis: AUD/USD and NZD/USD Test Support, Break or Bounce Next?
AUD/USD is attempting a fresh increase from 0.6630. NZD/USD is consolidating and could aim for a move above 0.5800 in the short term.
Important Takeaways for AUD/USD and NZD/USD Analysis Today
· The Aussie Dollar

USD/JPY Slides Towards Key Support
A Bank of Japan monetary policy meeting is due this week, and expectations around the decision are supporting the yen today. Traders increasingly believe that the central bank may raise its policy rate by 25 basis points to 0.75%