GBP/USD and GBP/JPY: British Pound Could Decline Further
GBP/USD failed to clear the 1.2300 resistance and started a fresh decline. GBP/JPY is also sliding and it might continue to move down towards the 130.50 level.
Important Takeaways for GBP/USD and GBP/JPY
- The British Pound declined recently and traded below the key 1.2200 support.
- There is a major declining channel forming with resistance near 1.2200 on the hourly chart of GBP/USD.
- GBP/JPY is following a bearish path and it is trading well below the 132.00 level.
- There is a crucial declining channel forming with resistance near 131.30 on the hourly chart.
GBP/USD Technical Analysis
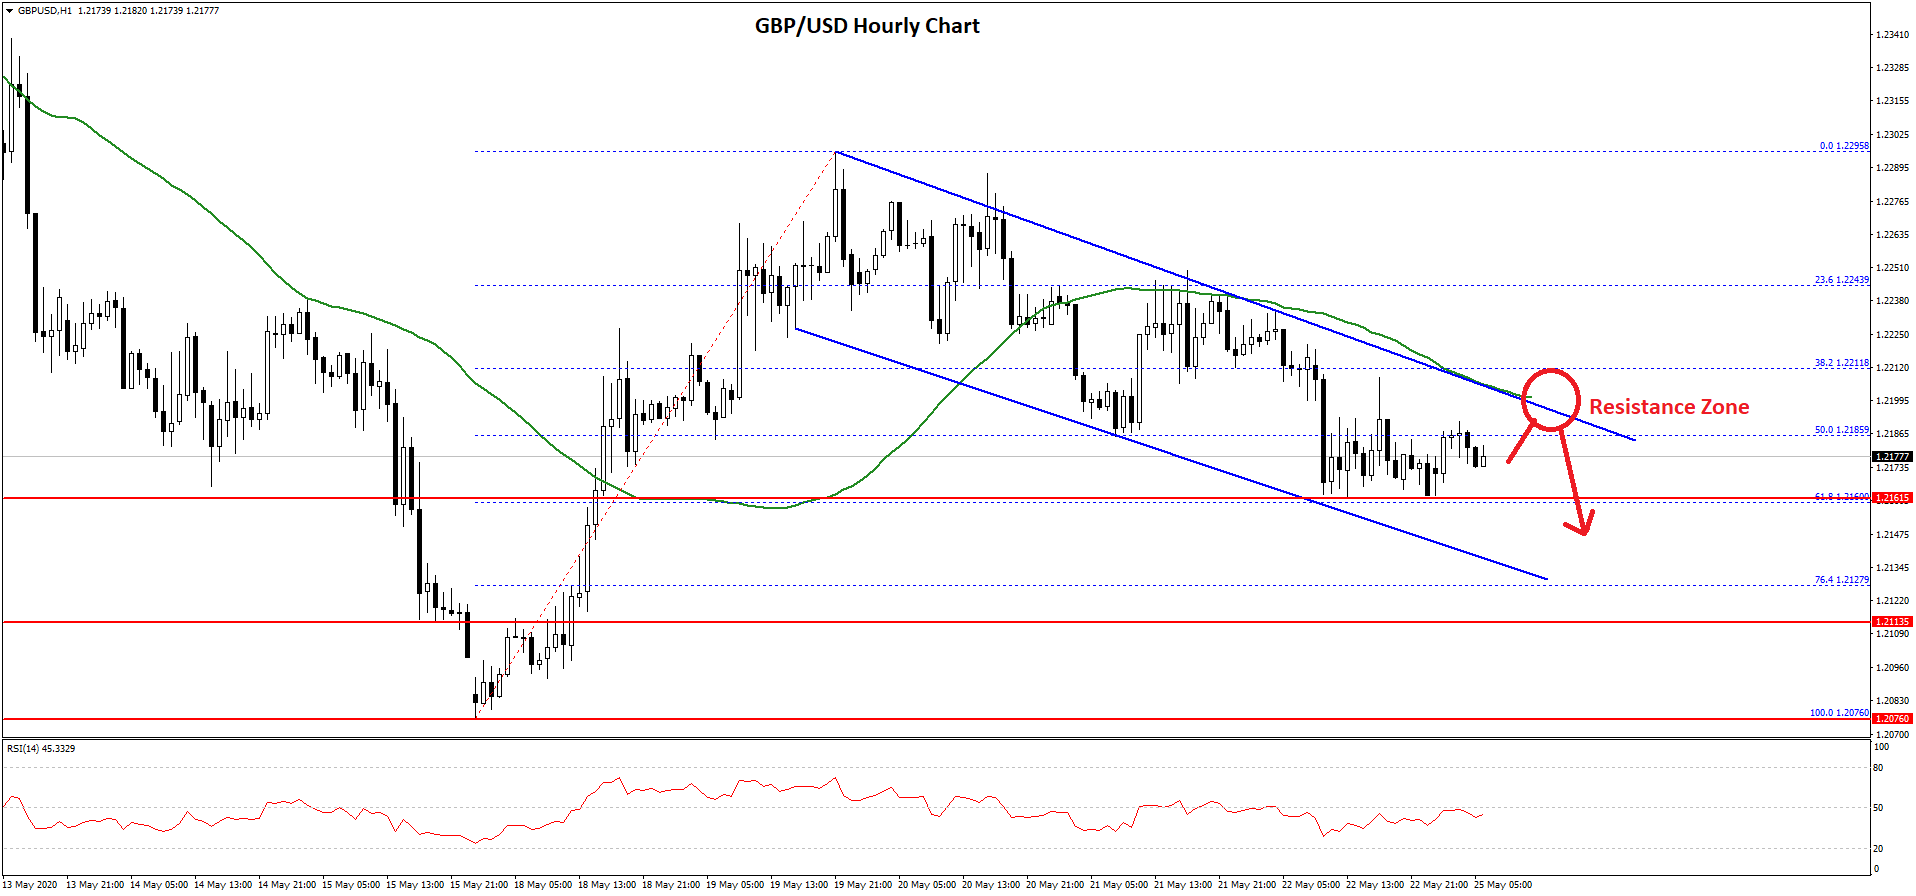
This past week, the British Pound recovered above 1.2200 and 1.2250 against the US Dollar. However, the GBP/USD pair failed to surpass the 1.2300 resistance zone.
A high was formed at 1.2295 on FXOpen before the pair started a fresh decline. There was a break below the 1.2250 support area and the 50 hourly simple moving average.
Moreover, the pair broke the 50% Fib retracement level of the upward move from the 1.2076 low to 1.2295 high. Finally, it spiked below 1.2200 and tested the 1.2160 support zone.
It seems like there is a major declining channel forming with resistance near 1.2200 on the hourly chart of GBP/USD. The channel resistance at 1.2200 is also near the 50 hourly simple moving average.
Therefore, the pair must break the channel resistance at 1.2200 and then settle above the 50 hourly simple moving average to start a fresh increase. The next major resistance above 1.2200 is near the 1.2250 level.
Conversely, the pair might continue to move down. An initial support is near the 1.2160 area. It is close to the 61.8% Fib retracement level of the upward move from the 1.2076 low to 1.2295 high.
If the pair breaks the 1.2160 and 1.2150 support levels, it might continue to move down towards the 1.2100 support zone in the coming sessions.
GBP/JPY Technical Analysis
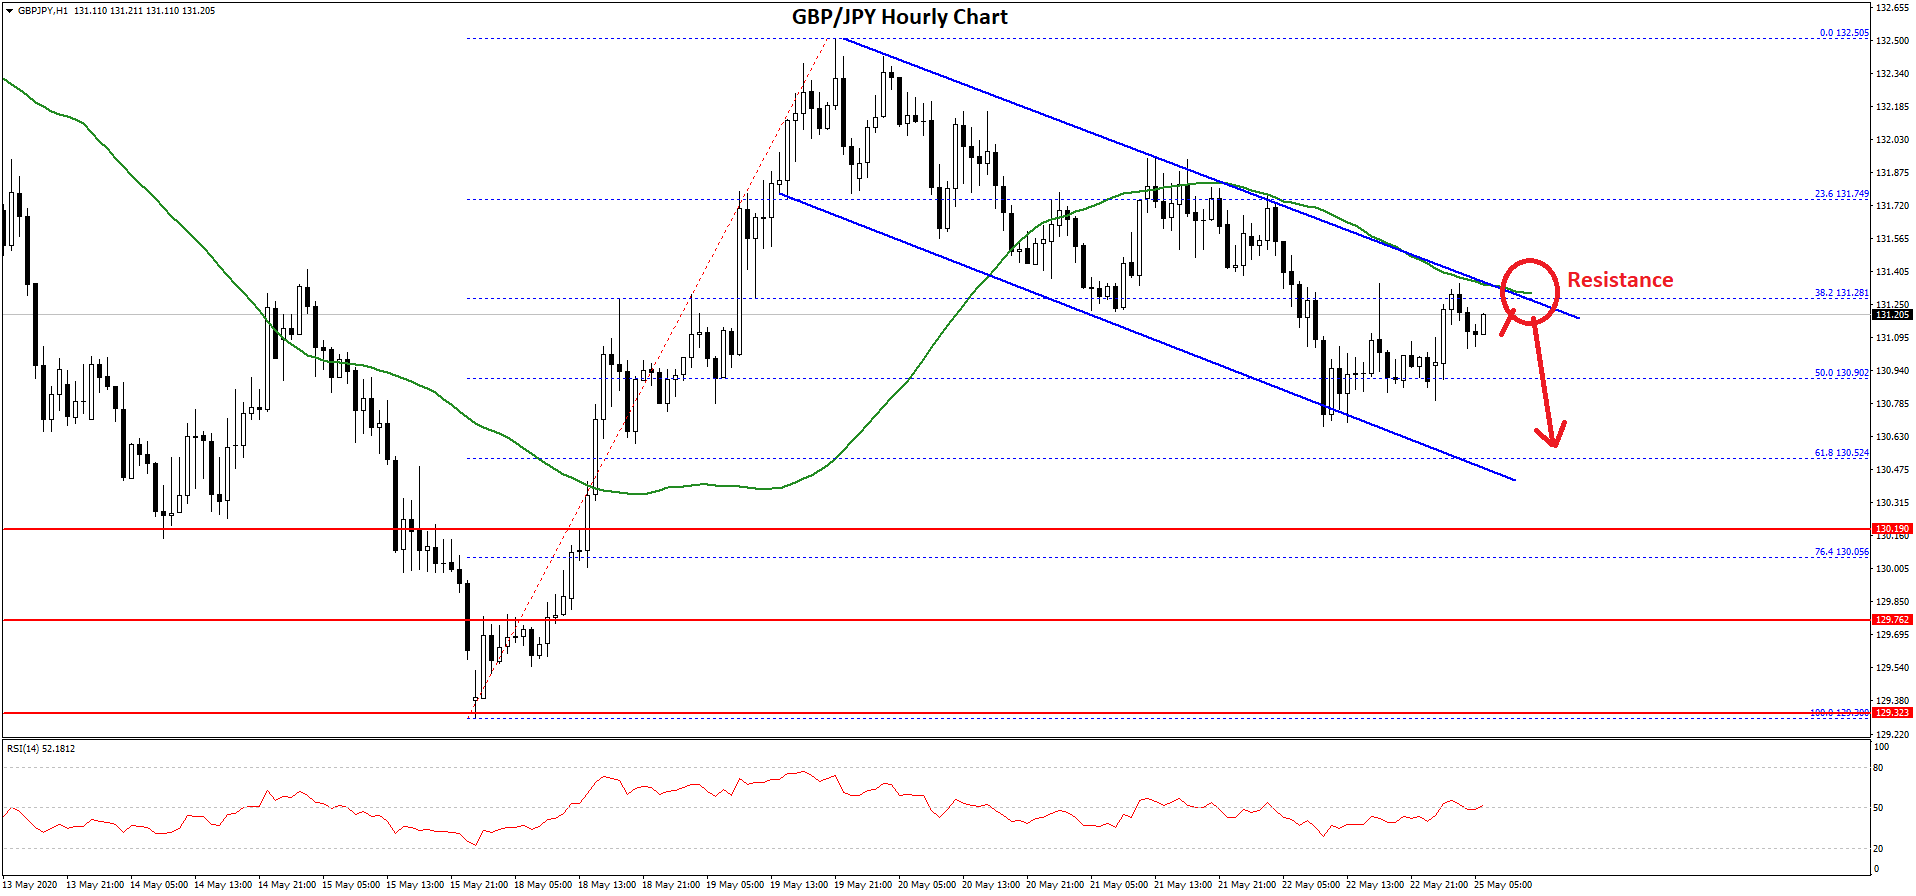
The British Pound is also following a similar pattern and trading below the 132.00 pivot level against the Japanese Yen. The GBP/JPY pair formed a short-term top near 132.50 before it declined below 132.00.
The recent decline was such that the pair settled below the 131.80 level and the 50 hourly simple moving average. Besides, there was a break below the 50% Fib retracement level of the upward move from the 129.30 low to 132.50 high.
Similar to GBP/USD, there is a crucial declining channel forming with resistance near 131.30 on the hourly chart of GBP/JPY. The channel resistance at 131.30 is also near the 50 hourly simple moving average.
Therefore, the pair must break the channel resistance at 131.30 and the 50 hourly simple moving average to avoid more losses. The next major resistance above 131.30 is near the 131.75 level. Any further gains could increase chances of a push above the 132.00 resistance.
If the pair fails to recover above the 131.30 resistance, there are chances of a sustained decline. An initial support is near the 130.80 level. The next key support is near the 130.50 level.
It is close to the 61.8% Fib retracement level of the upward move from the 129.30 low to 132.50 high. Any further losses may perhaps lead the pair towards the 130.00 support.