


GBP/USD and GBP/JPY: British Pound Could Extend Gains
FXOpen
GBP/USD started a strong increase above the 1.2850 and 1.3000 resistance levels. GBP/JPY is also rising and it is likely to continue higher above 139.00 unless there is a break below 138.00.
Important Takeaways for GBP/USD and GBP/JPY
- The British Pound gained bullish momentum and it even surpassed the 1.3000 barrier.
- There is a crucial bullish trend line forming with support near 1.3060 on the hourly chart of GBP/USD.
- GBP/JPY also rallied and climbed above the 138.00 and 138.50 resistance levels.
- There is a key bullish trend line forming with support near 138.00 on the hourly chart.
GBP/USD Technical Analysis
This past week, the British Pound started a strong increase above the 1.2880 resistance against the US Dollar. The GBP/USD pair gained bullish momentum and it even surpassed the 1.3000 barrier.
The pair broke the 1.3100 level and settled well above the 50 hourly simple moving average. It traded as high as 1.3170 on FXOpen and recently started a downside correction. There was a break below the 1.3120 support level.
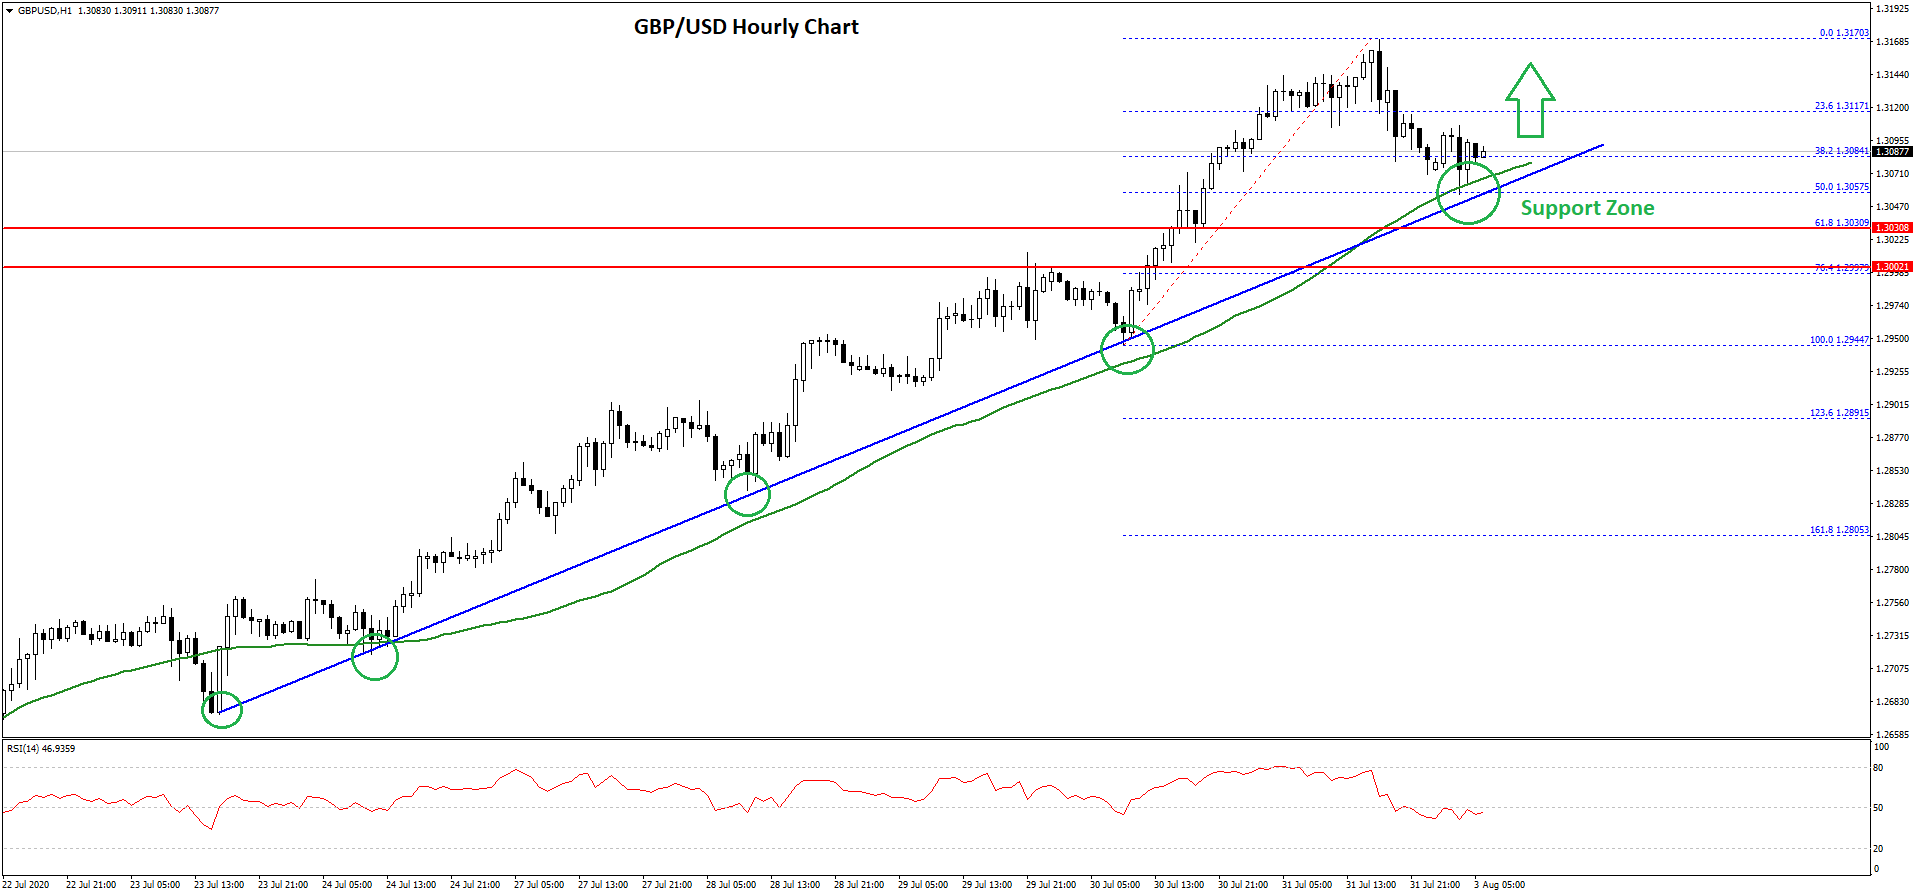
The pair traded below the 38.2% Fib retracement level of the upward wave from the 1.2944 low to 1.3170 high. However, the pair remained stable above the 1.3060 level.
It seems like the 50% Fib retracement level of the upward wave from the 1.2944 low to 1.3170 high acted as a strong support. There is also a crucial bullish trend line forming with support near 1.3060 on the hourly chart of GBP/USD.
The pair is currently trading nicely above the 1.3060 support, the trend line, and the 50 hourly simple moving average. If there is a downside break below the trend line, the pair could test the 1.3040 support. The next major support is near the 1.3000 handle, below which GBP/USD might turn bearish.
Conversely, the pair could continue to rise above the 1.3100 level. The main hurdles on the upside are near 1.3150 and 1.3200.
GBP/JPY Technical Analysis
The British Pound also gained bullish momentum above the 137.50 resistance against the Japanese Yen. The GBP/JPY pair settled above the 138.00 pivot level to move into a positive zone.
Finally, there was a break above the 139.00 level and the pair settled nicely above the 50 hourly simple moving average. A high was formed near 139.21 before the pair started a decent downside correction.
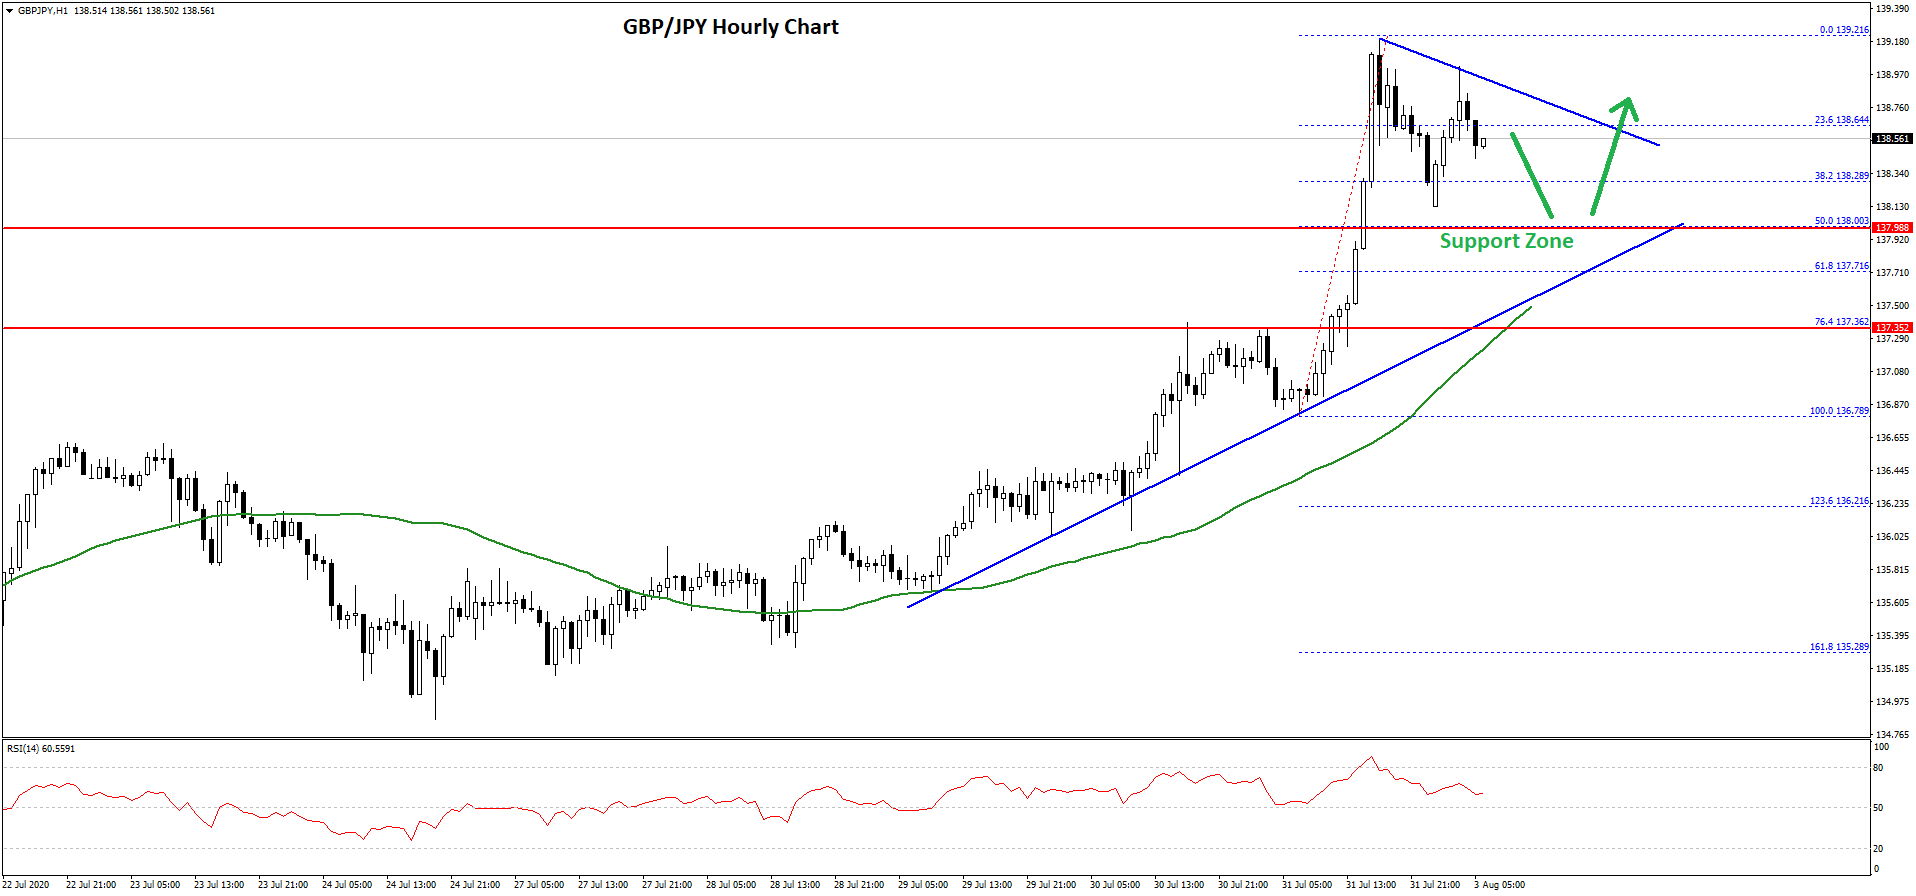
There was a break below the 139.00 level, and the 23.6% Fib retracement level of the upward wave from the 136.78 low to 139.21 high. The pair is currently trading near the 138.50 level. On the downside, there are many important supports near the 138.00 level.
There is a key bullish trend line forming with support near 138.00 on the hourly chart. The trend line is close to the 50% Fib retracement level of the upward wave from the 136.78 low to 139.21 high.
If there is a downside break below the trend line and the 138.00 support, the pair could correct further lower. The next major support is near the 137.50 level and the 50 hourly SMA.
On the upside, the pair is facing hurdles near 138.70 level and a connecting bearish trend line. Once the current correction wave is over, the GBP/JPY pair might make an attempt to climb above the 138.70 and 139.00 resistance levels in the near term.
Trade over 50 forex markets 24 hours a day with FXOpen. Take advantage of low commissions, deep liquidity, and spreads from 0.0 pips (additional fees may apply). Open your FXOpen account now or learn more about trading forex with FXOpen.
This article represents the opinion of the Companies operating under the FXOpen brand only. It is not to be construed as an offer, solicitation, or recommendation with respect to products and services provided by the Companies operating under the FXOpen brand, nor is it to be considered financial advice.
Stay ahead of the market!
Subscribe now to our mailing list and receive the latest market news and insights delivered directly to your inbox.


Latest articles

US Dollar Index: A Defining Week for the King of the Markets
The dollar heads into a pivotal week trading near 101.80, just off a 15-month high, with the Fed's July 29 meeting standing as the clear focal point. Markets currently price roughly a 65% chance of a hold, though renewed

NZD/USD: Inflation Surge Meets Strong US Dollar Pressure
On 21 July, Stats NZ reported an acceleration in inflation: the Consumer Price Index rose 1.5% in the second quarter, while the annual inflation rate climbed to 4.1%, its highest level in more than two years and slightly

Weekly Market Insights with Gary Thomson: The Week of Central Banks and Earnings
In this video, we’ll explore the key economic events and market trends, shaping the financial landscape. Get ready for insights into financial markets to help you navigate the week ahead. Let’s dive in!
In this episode of Market