


GBP/USD and GBP/JPY: British Pound Signaling More Upsides
FXOpen

GBP/USD started a strong increase after it broke the 1.2950 and 1.3000 resistance levels. GBP/JPY is trading nicely above 137.00 and it might continue to climb higher.
Important Takeaways for GBP/USD and GBP/JPY
- The British Pound finally managed to clear the key 1.3000 resistance.
- There is a crucial bullish trend line forming with support near 1.2970 on the hourly chart of GBP/USD.
- GBP/JPY is also showing positive signs above the 137.20 and 137.00 support levels.
- There is a major bullish trend line forming with support near 137.15 on the hourly chart.
GBP/USD Technical Analysis
This past week, the British Pound struggled on many occasions near the 1.2980 and 1.3000 resistance levels against the US Dollar. Finally, the GBP/USD pair gained momentum and was able to clear the main 1.3000 resistance level.
The pair formed a strong support base above the 1.2920 level and it climbed higher nicely above the 50 hourly simple moving average. There was a successful close above the 1.3000 level and the pair traded to a new weekly high at 1.3049 on FXOpen.
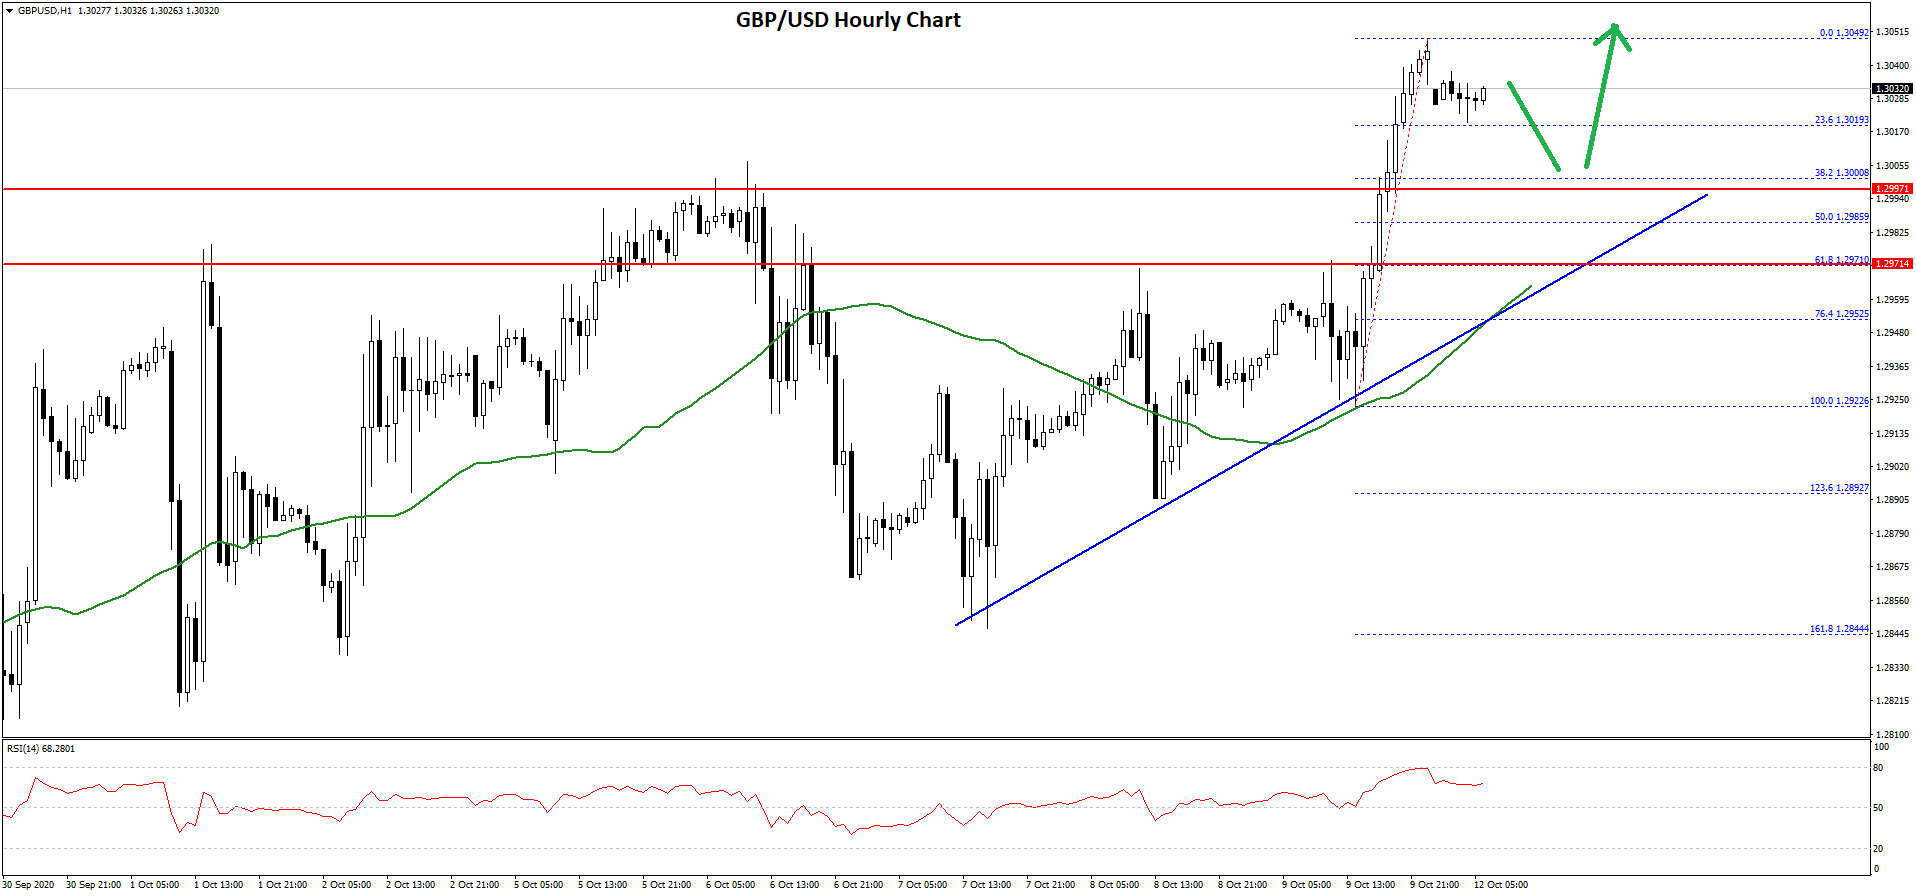
The pair is currently consolidating gains above the 1.3020 support. It is also trading above the 23.6% Fib retracement level of the upward move from the 1.2922 low to 1.3049 high.
On the downside, there are many important supports forming near the 1.3000 and 1.2980 levels. There is also a crucial bullish trend line forming with support near 1.2970 on the hourly chart of GBP/USD. The trend line coincides with the 50% Fib retracement level of the upward move from the 1.2922 low to 1.3049 high.
If there is a downside break below the trend line, the pair could correct further lower towards the 1.2925 and 1.2920 support levels.
On the upside, the first major hurdles for the bulls is near the 1.3050 level. A clear break above the 1.3050 resistance is likely to open the doors for a sustained upward move in the coming sessions.
GBP/JPY Technical Analysis
The British Pound also gained bullish momentum above 136.50 level against the Japanese Yen. The GBP/JPY pair broke the 137.00 resistance to move into a positive zone.
There was also a close above the 137.40 level and the 50 hourly simple moving average. The pair traded towards the 138.00 resistance and a high is formed near 137.81. It is currently correcting lower and trading below 137.60.
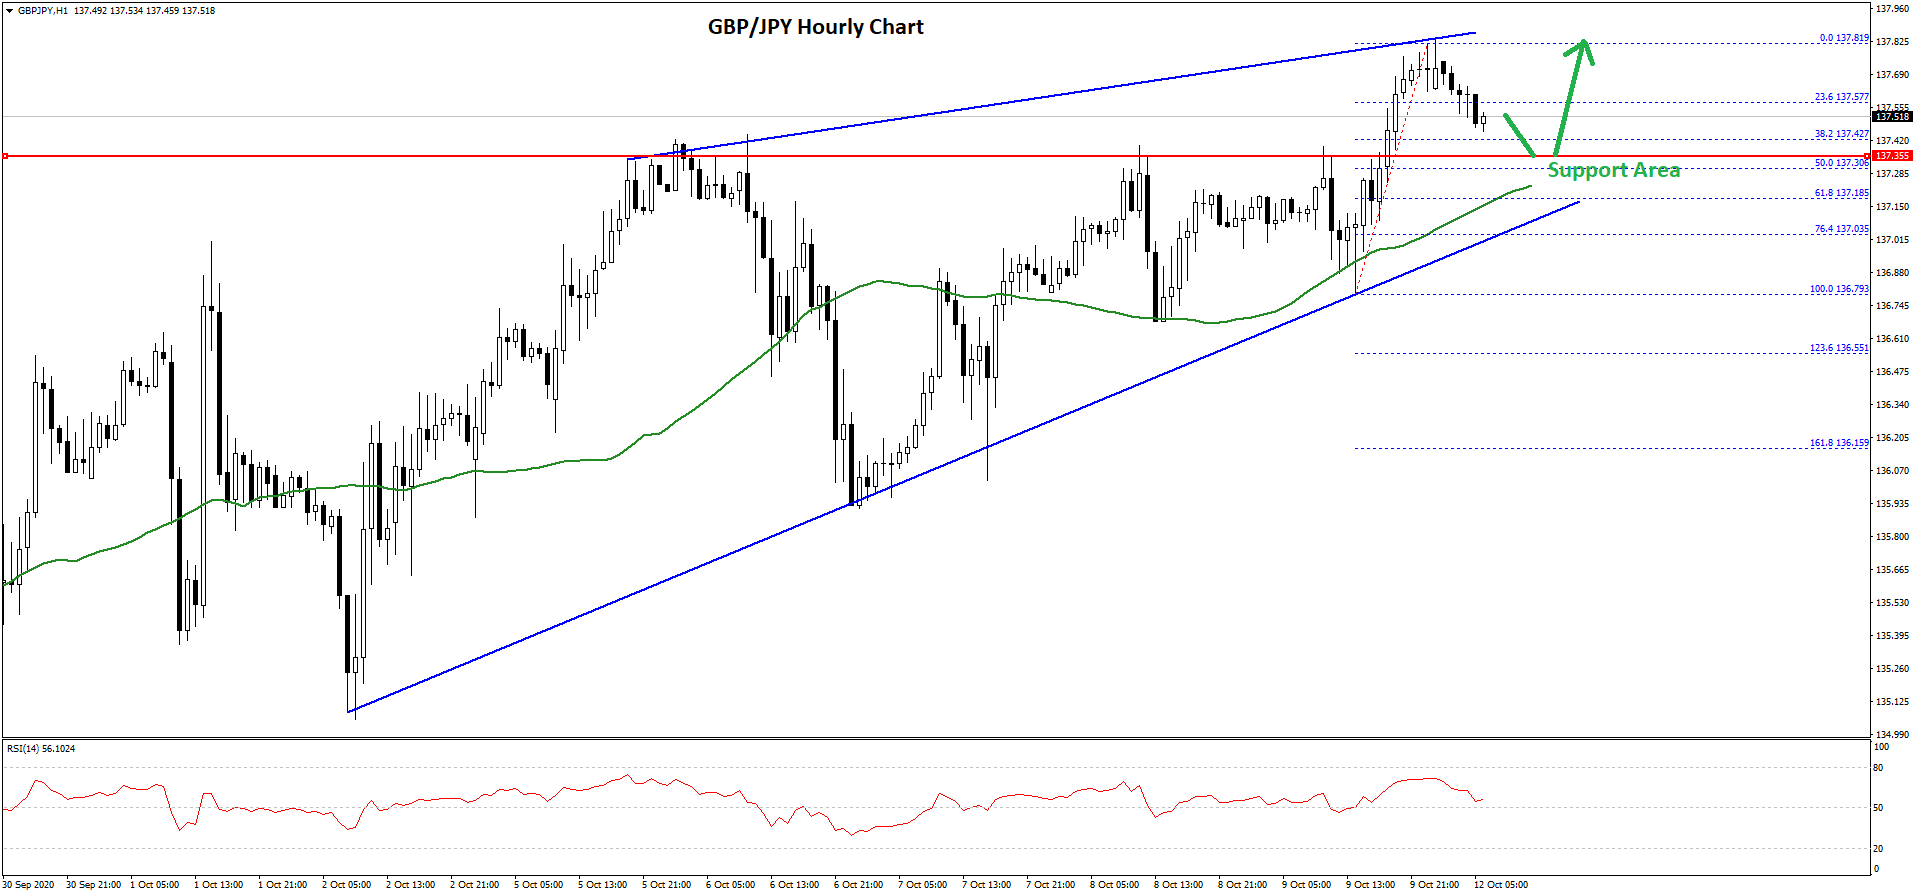
There was a break below the 23.6% Fib retracement level of the upward move from the 136.79 low to 137.81 high. On the downside, there are many supports, starting with 137.40 and 137.30.
The 50% Fib retracement level of the upward move from the 136.79 low to 137.81 high is also near the 137.30 level. Moreover, there is a major bullish trend line forming with support near 137.15 on the hourly chart.
If there is a downside break below the trend line, the pair could even break the 137.00 support and continue lower in the near term.
On the upside, the pair is facing hurdles near the 137.75 and 137.80 levels. The main resistance is near 138.00, above which GBP/JPY could rise steadily towards 138.80 and 139.20 levels. The next major resistance for the bulls could be near the 140.00 level.
Trade over 50 forex markets 24 hours a day with FXOpen. Take advantage of low commissions, deep liquidity, and spreads from 0.0 pips (additional fees may apply). Open your FXOpen account now or learn more about trading forex with FXOpen.
This article represents the opinion of the Companies operating under the FXOpen brand only. It is not to be construed as an offer, solicitation, or recommendation with respect to products and services provided by the Companies operating under the FXOpen brand, nor is it to be considered financial advice.
Stay ahead of the market!
Subscribe now to our mailing list and receive the latest market news and insights delivered directly to your inbox.


Latest articles

Apple: Earnings Day Above the Activity Zone
On 30 April, after the market close, Apple Inc. will release its financial results for the second quarter of fiscal 2026. The consensus forecast, based on estimates from 31 analysts, points to revenue of around $109.7 billion, with expected

USD/JPY and USD/CHF Near Key Levels: The Dollar Supported by the Fed
The US dollar continues to trend upwards following the Federal Reserve meeting, drawing support from the regulator’s moderately hawkish stance and comments by Jerome Powell. Markets interpret the Fed’s rhetoric as a signal that restrictive policy is likely

EUR/USD and GBP/USD consolidate ahead of the Fed decision
European currencies are showing subdued dynamics, entering a consolidation phase following their previous advance. Earlier, EUR/USD and GBP/USD broke out of their ranges and strengthened; however, the subsequent correction has led both pairs to retest the previously breached