


GBP/USD And USD/CAD Eyeing Key Upside Break
FXOpen

GBP/USD started a fresh increase and it broke the 1.3250 resistance. USD/CAD is recovering and it is eyeing an upside break above 1.3100.
Important Takeaways for GBP/USD and USD/CAD
- The British Pound climbed higher above the 1.3200 and1.3250 resistance levels.
- There is a major bullish trend line forming with support near 1.3255 on the hourly chart of GBP/USD.
- USD/CAD is trading nicely above the 1.3040 support and it is currently recovering.
- There is a key bearish trend line forming with resistance near 1.3100 on the hourly chart.
GBP/USD Technical Analysis
This past week, the British Pound started a fresh increase from the 1.3120 support level against the US Dollar. The GBP/USD pair broke the 1.3150 and 1.3200 resistance levels to move into a positive zone.
The pair even broke the 1.3250 resistance and settled above the 50 hourly simple moving average. Finally, there was a spike above the 1.3300 resistance, but the pair struggled to gain strength.
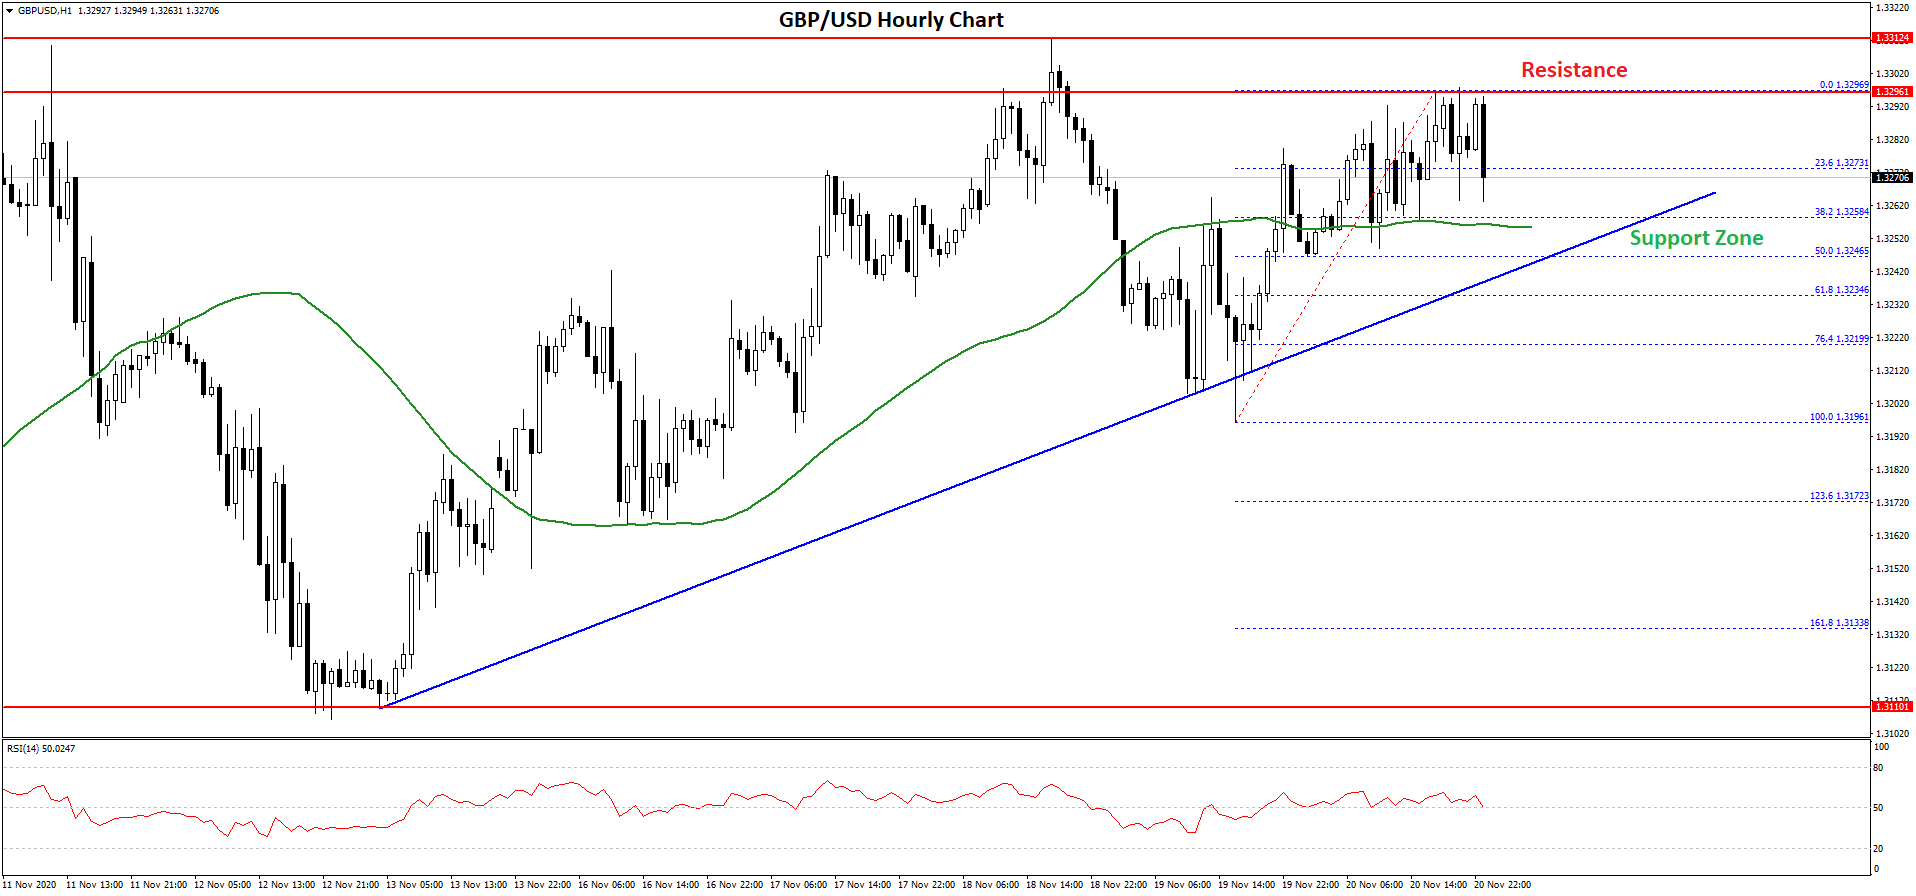
There were more than two attempts to clear the 1.3300 barrier, but the pair failed. A swing high was formed near 1.3296 on FXOpen and the pair is currently consolidating gains. An initial support on the downside is near the 1.3260 level or the 50 hourly simple moving average.
It is close to the 38.2% Fib retracement level of the recent wave from the 1.3196 swing low to 1.3296 high. There is also a major bullish trend line forming with support near 1.3255 on the hourly chart of GBP/USD.
The next major support is near the 1.3245 level or the 50% Fib retracement level of the recent wave from the 1.3196 swing low to 1.3296 high. Any more losses could lead the pair towards the 1.3200 support zone.
On the upside, the 1.3300 level is a strong resistance. A successful close above the 1.3300 resistance may perhaps open the doors for a larger increase towards 1.3350 or 1.3420.
USD/CAD Technical Analysis
The US Dollar saw a couple of swing moves below the 1.3100 level against the Canadian Dollar. However, the USD/CAD pair remained stable and well bid above the 1.3000 support zone.
The last swing low was formed near 1.3096 before the pair started a decent recovery wave. There was a break above the 1.3065 resistance level and the 50 hourly simple moving average.
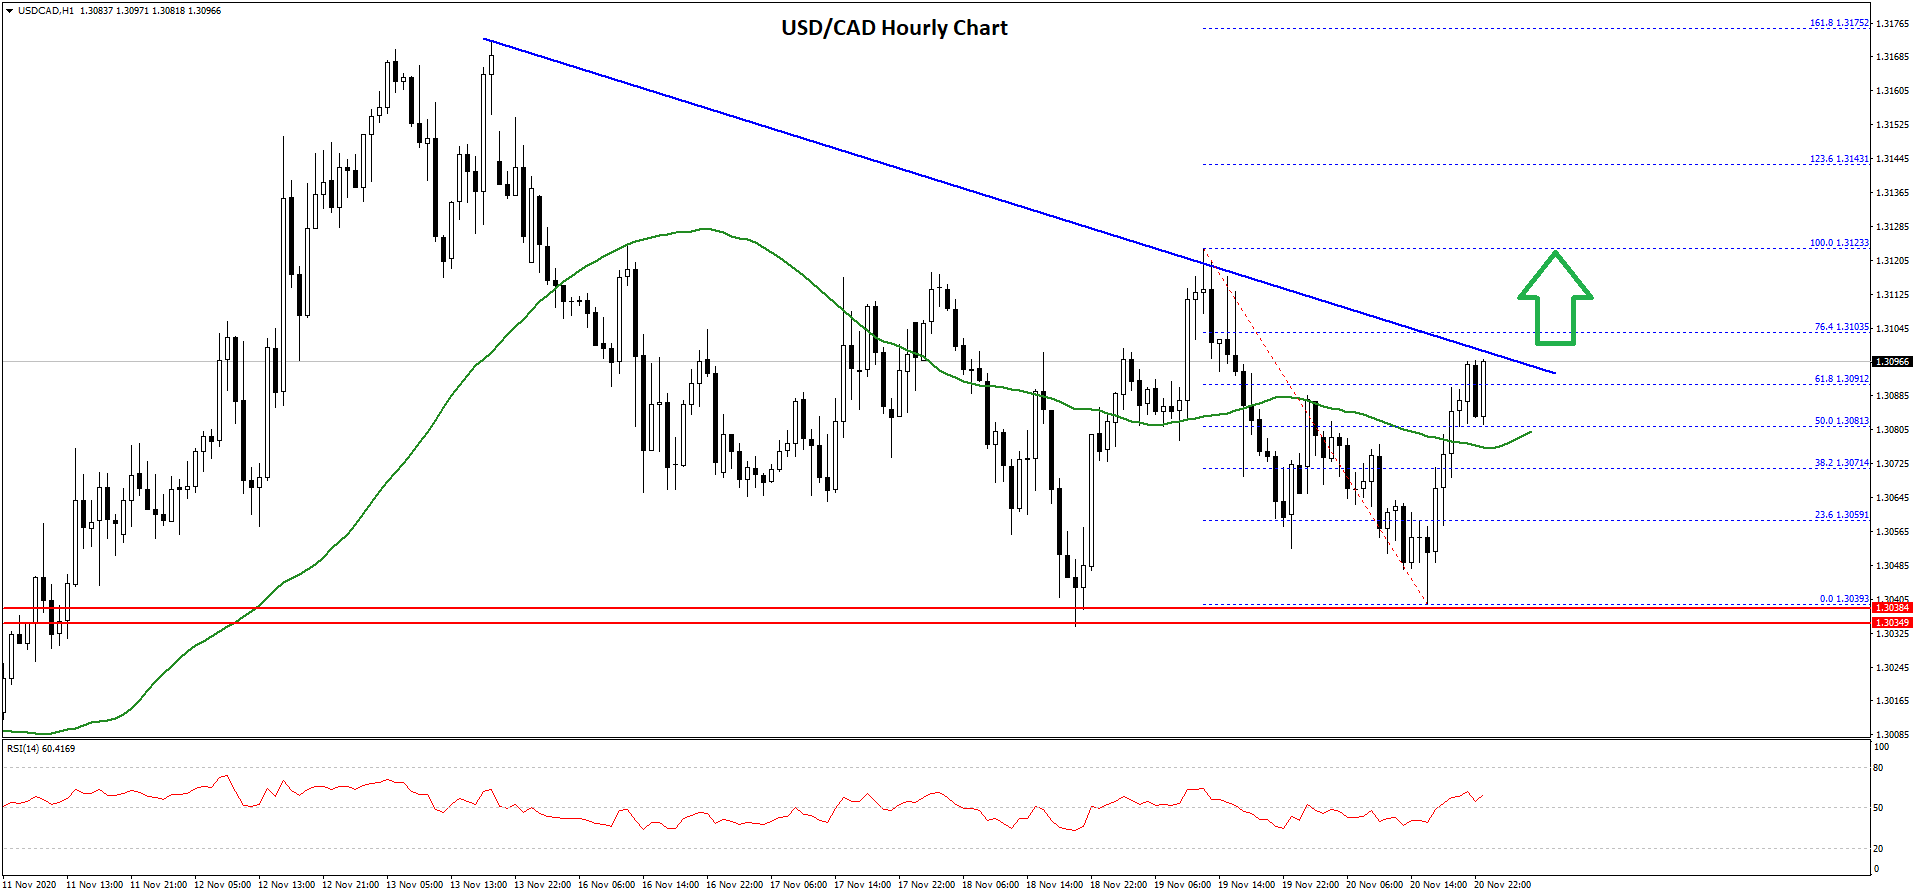
Moreover, there was a break above the 50% Fib retracement level of the recent decline from the 1.3123 high to 1.3039 low. The pair is now struggling to clear the 1.3100 resistance. There is also a key bearish trend line forming with resistance near 1.3100 on the hourly chart.
The trend line is close to the 76.4% Fib retracement level of the recent decline from the 1.3123 high to 1.3039 low. Therefore, a successful break and close above the 1.3100 resistance level could spark a strong upward move.
The next key resistance is near the 1.3145 level. Conversely, the pair might struggle to clear the 1.3100 resistance and start a fresh decline. An initial support is near the 1.3080 level and the 50 hourly simple moving average.
The next major support is near the 1.3050 level, below which the pair might struggle to stay above the 1.3040 support zone in the near term.
Trade over 50 forex markets 24 hours a day with FXOpen. Take advantage of low commissions, deep liquidity, and spreads from 0.0 pips (additional fees may apply). Open your FXOpen account now or learn more about trading forex with FXOpen.
This article represents the opinion of the Companies operating under the FXOpen brand only. It is not to be construed as an offer, solicitation, or recommendation with respect to products and services provided by the Companies operating under the FXOpen brand, nor is it to be considered financial advice.
Stay ahead of the market!
Subscribe now to our mailing list and receive the latest market news and insights delivered directly to your inbox.


Latest articles

EUR/USD Eyes Gains As USD/CHF Weakness Deepens Again
EUR/USD started a fresh increase above 1.1700 and 1.1720. USD/CHF declined further and is now struggling below 0.7835.
Important Takeaways for EUR/USD and USD/CHF Analysis Today
· The Euro started a decent increase from

Apple: Earnings Day Above the Activity Zone
On 30 April, after the market close, Apple Inc. will release its financial results for the second quarter of fiscal 2026. The consensus forecast, based on estimates from 31 analysts, points to revenue of around $109.7 billion, with expected

USD/JPY and USD/CHF Near Key Levels: The Dollar Supported by the Fed
The US dollar continues to trend upwards following the Federal Reserve meeting, drawing support from the regulator’s moderately hawkish stance and comments by Jerome Powell. Markets interpret the Fed’s rhetoric as a signal that restrictive policy is likely