GBP/USD and USD/JPY Dips Remain Supported
GBP/USD recovered recently above the 1.3080 resistance. USD/JPY is currently correcting lower, but dips remain supported above the 113.50 and 113.30 levels.
Important Takeaways for GBP/USD and USD/JPY
- The British Pound found support near the 1.2925 level and recovered against the US Dollar.
- The GBP/USD pair broke a key bearish trend line with resistance at 1.3025 on the hourly chart.
- USD/JPY started a downside correction after trading as high as 114.54.
- The pair is following a major bearish trend line with resistance at 113.88 on the hourly chart.
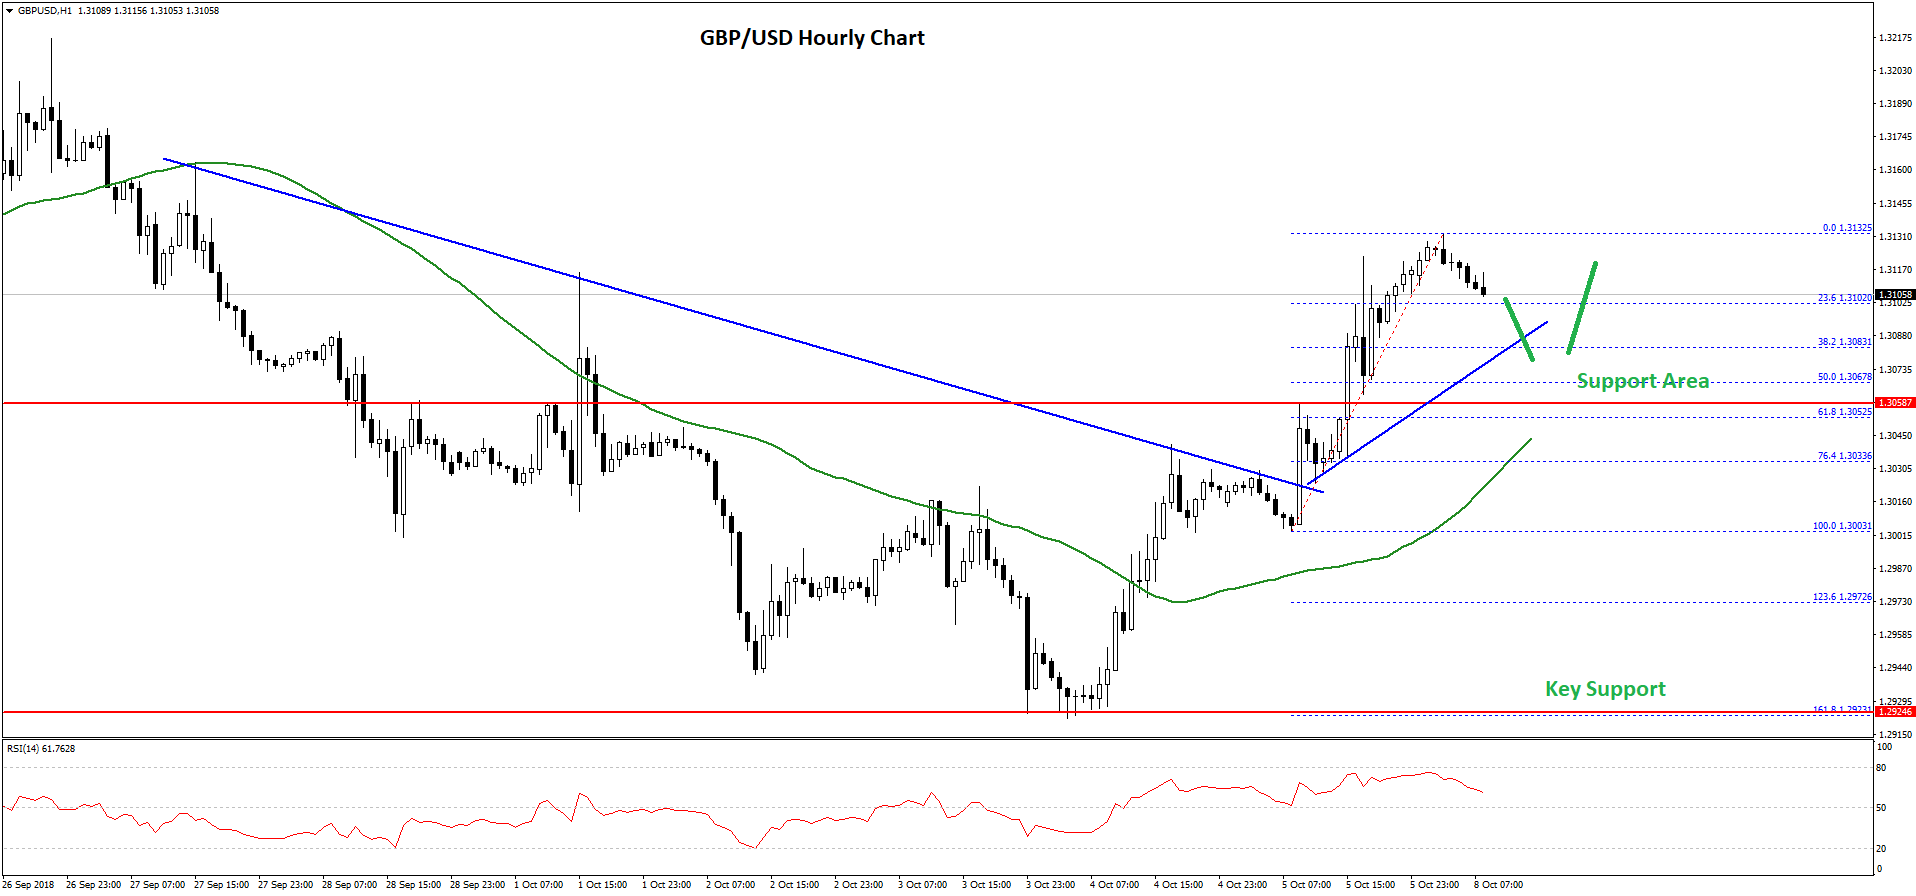
GBP/USD Technical Analysis
The British Pound was under pressure this past week as it declined below the 1.3000 support against the US Dollar. The GBP/USD pair even broke the 1.2950 support and it almost tested the 1.2900 support.
The pair traded as low as 1.2922 and later formed a support base for a recovery. Buyers took control and pushed the price above the 1.2950 and 1.3000 resistance levels. The recovery was solid as the pair traded above the 1.3080 resistance and the 50 hourly simple moving average.
During the rise, the pair broke a key bearish trend line with resistance at 1.3025 on the hourly chart. There was also a spike above the 1.3100 level and the pair traded as high as 1.3132.
Later, the pair started a downside correction and traded below the 1.3110 level. At the outset, it is testing the 23.6% Fib retracement level of the last leg from the 1.3003 low to 1.3132 high.
On the downside, there is a decent support formed near the 1.3080 level and a connecting bullish trend line. Below the trend line, the next support is the 50% Fib retracement level of the last leg from the 1.3003 low to 1.3132 high at 1.3067.
The key supports below 1.3067 are at 1.3055 and 1.3050. As long as GBP/USD is trading above 1.3050, it could continue to move higher towards the 1.3150 and 1.3180 resistance levels in the near term.
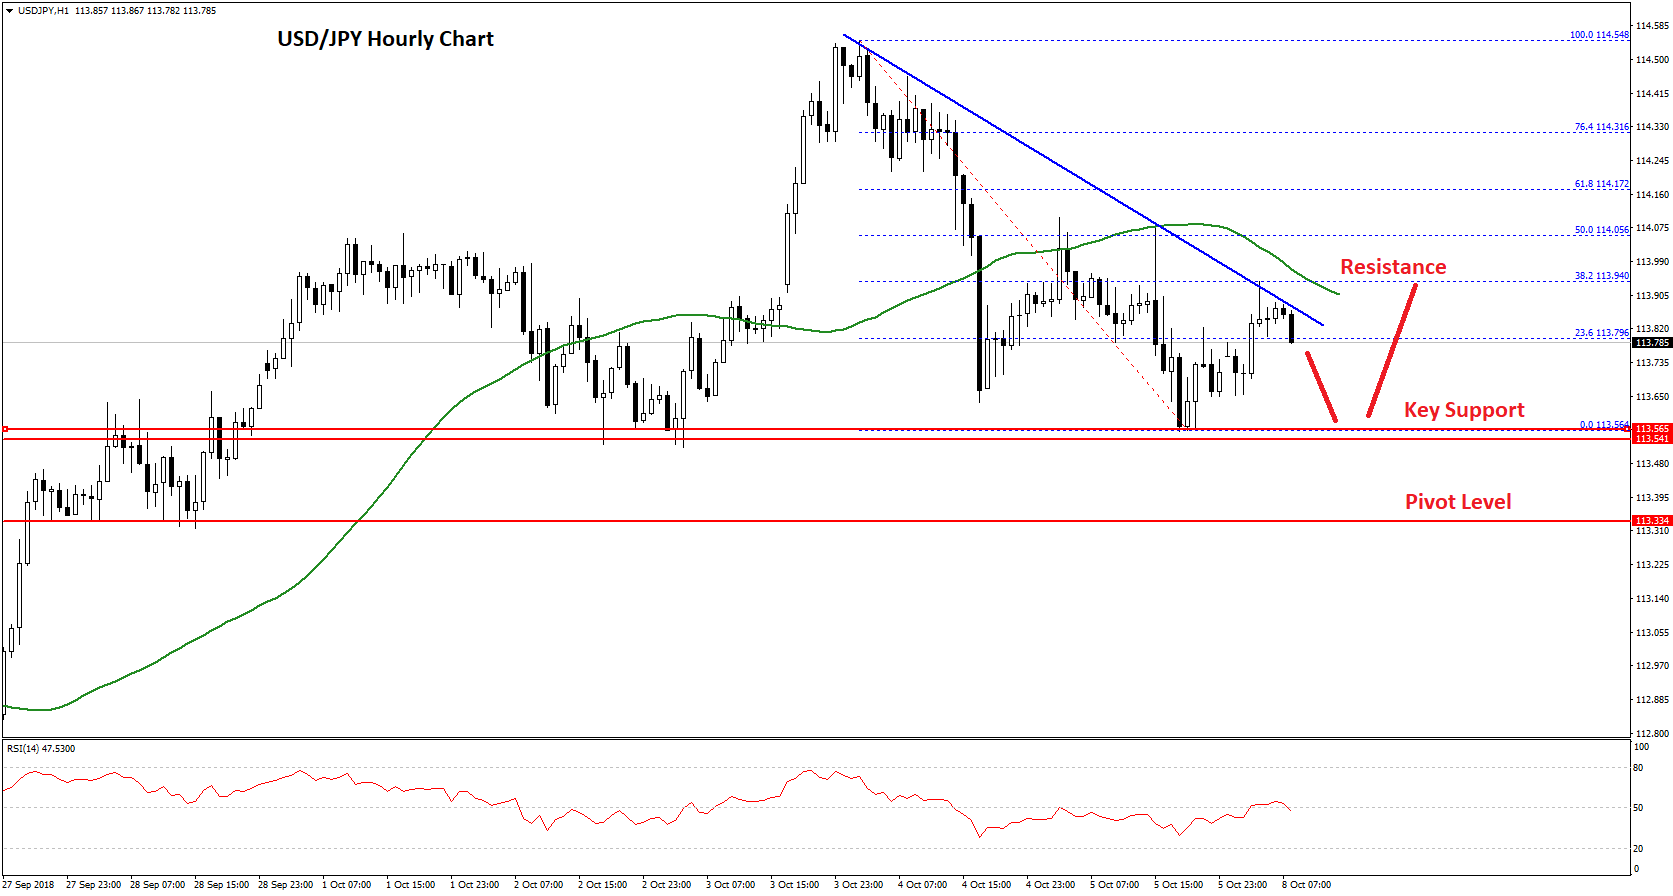
USD/JPY Technical Analysis
The US Dollar gained traction this past week and traded higher from the 113.00 support against the Japanese Yen. The USD/JPY pair broke the 114.00 and 114.40 resistance levels to move into a positive zone.
The pair traded as high as 114.54 and later started a downside correction. It declined below 114.00 and 113.80 support levels, plus settled below the 50 hourly simple moving average.
However, the pair found a strong support near the 113.55 level, which was a resistance earlier. It recovered recently and traded above the 23.6% Fib retracement level of the last drop from the 114.54 high to 113.56 low.
The upside move was capped by the 114.00 resistance, the 50 hourly simple moving average, and the 50% Fib retracement level of the last drop from the 114.54 high to 113.56 low.
More importantly, the pair is following a major bearish trend line with current resistance at 113.88 on the hourly chart. Therefore, a break and close above the trend line, 114.00, and the 50 hourly SMA is needed for buyers to gain momentum towards the 114.50 high.
On the downside, the 113.55 and 113.50 support levels hold the key. Below these, the next important support for the current uptrend is at 113.30, below which USD/JPY could drop to 112.50.