GBP/USD Correcting Higher and Upsides Capped in USD/JPY
GBP/USD found a strong support near 1.2660 and recovered. USD/JPY remained in a bearish zone and is facing many resistances near 110.70-80
Important Takeaways for GBP/USD and USD/JPY
- The British Pound declined towards the 1.2650-60 support area and corrected higher against the US Dollar.
- The GBP/USD pair is following a short-term ascending channel with support at 1.2720 on the hourly chart.
- USD/JPY declined below the 111.20 and 111.00 support levels and tested 110.30.
- The pair is currently correcting higher, but it is likely to face sellers near 110.70/80.
GBP/USD Technical Analysis
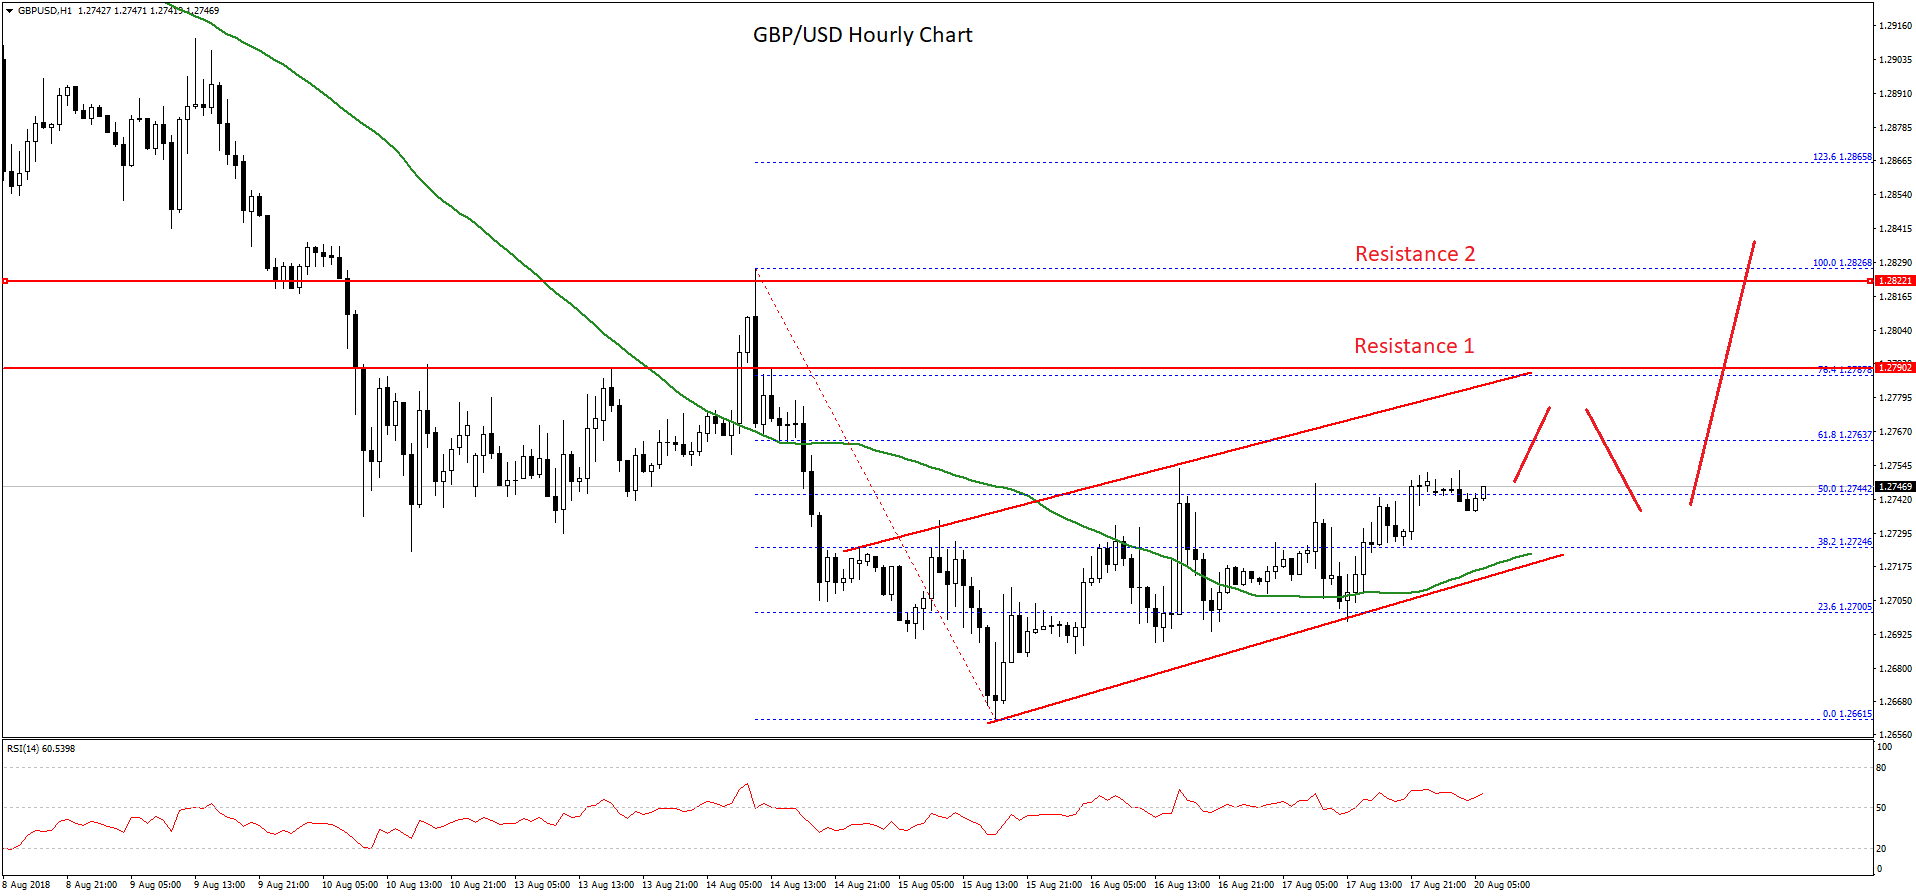
The British Pound fell significantly recently from the 1.2800 swing high against the US Dollar. The GBP/USD pair even broke the 1.2750 and 1.2700 support levels and traded close to 1.2650.
The pair found a strong buying interest above the 1.2660, resulting in the start of an upward move. There was a decent correction as the pair moved above the 1.2700 resistance and the 50 hourly simple moving average.
There was also a break above the 38.2% Fib retracement level of the last decline from the 1.2876 high to 1.2661 low. However, the pair is currently facing sellers near the 1.2740-50 zone.
Moreover, the pair is struggling to settle above the 50% Fib retracement level of the last decline from the 1.2876 high to 1.2661 low. Therefore, there could be a minor downside move towards the 1.2700/20 support area.
More importantly, there is a short-term ascending channel in place with support at 1.2720 on the hourly chart. As long as the pair is above the channel support, it could break the 1.2750 resistance, above which, there are chances of buyers pushing the pair towards the 1.2800 level.
On the flip side, if the pair breaks the channel support and 1.2700, the pair could resume its downside move. In the mentioned case, the pair may even retest the 1.2660 support area in the near term.
USD/JPY Technical Analysis
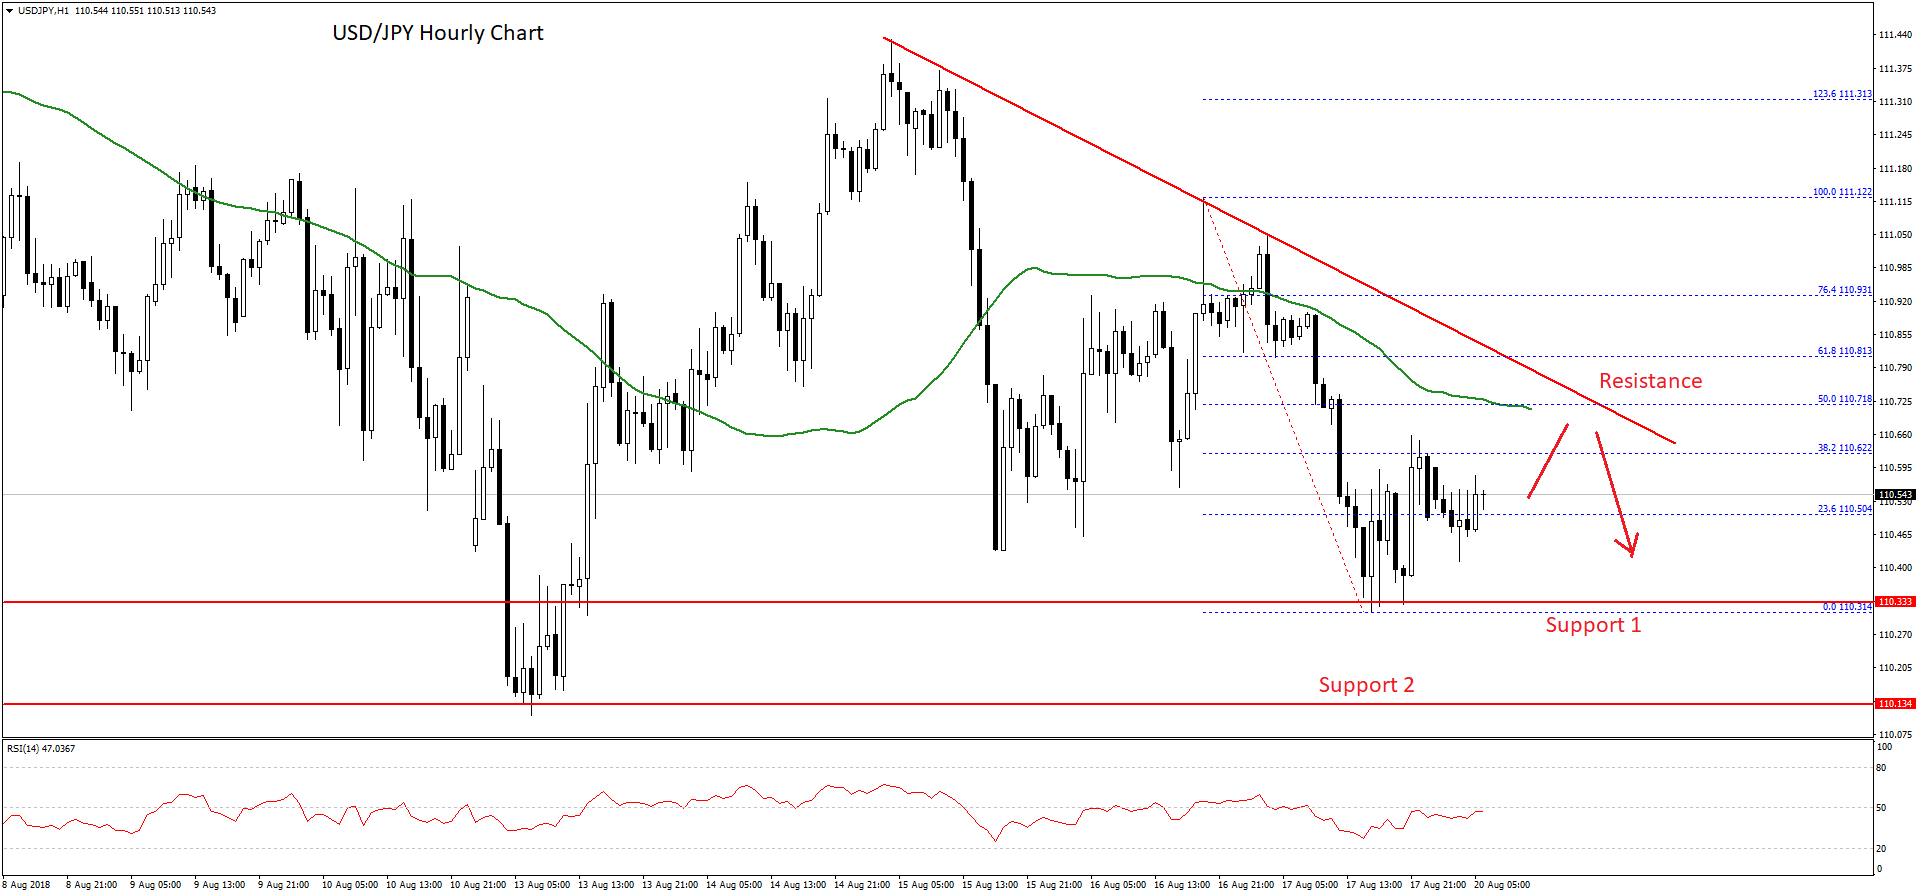
The US Dollar struggled to hold gains above the 111.40 and 111.50 levels against the Japanese Yen. The USD/JPY pair started a downside move and broke the 111.00 support area.
The decline was such that the pair also broke the 110.80 support and settled below the 50 hourly simple moving average. There was a test of the 110.30 support area before the pair started consolidating losses.
It formed a base above 110.30 and it is currently correcting higher. It has moved above the 23.6% Fib retracement level of the last decline from the 111.12 high to 110.31 low. However, there are many resistances waiting on the upside for buyers near the 110.70 and 110.80 levels.
On the upside, there is a key bearish trend line formed with resistance at 110.72 on the hourly chart, which coincides with the 50 hourly SMA. Moreover, the 50% Fib retracement level of the last decline from the 111.12 high to 110.31 low is near the 110.70 level.
Therefore, it won’t be easy for USD/JPY buyers to push the price above the 110.70 and 110.80 resistance levels. Should they succeed, the pair may perhaps break 111.00 for more upsides.
On the other hand, if the pair fails to break 110.80, it could decline once again. Supports on the downside are at 110.50 and 110.40. The most important support is at 110.30, below which, the pair is likely to test 110.00.