


GBP/USD Could Continue Higher, USD/CAD Is Correcting Lower
FXOpen
GBP/USD remained well bid above the 1.2800 area and recently started a fresh increase above 1.2875. USD/CAD topped near the 1.3200 area and it is currently correcting lower.
Important Takeaways for GBP/USD and USD/CAD
- The British Pound jumped higher recently above the 1.2875 and 1.2900 resistance levels.
- There is a connecting bullish trend line forming with support near 1.2920 on the hourly chart of GBP/USD.
- USD/CAD started a downside correction after trading as high as 1.3207.
- There is a declining channel forming with support near 1.3125 on the hourly chart.
GBP/USD Technical Analysis
After a downside correction, the British Pound found support near the 1.2800 area against the US Dollar. The GBP/USD pair formed a support base near 1.2810 and started a fresh increase.
The pair broke a few important resistances near the 1.2850 level to move into a positive zone. Moreover, there was a break above the 1.2880 barrier and the 50 hourly simple moving average. Finally, the pair climbed above the 1.2900 level and traded as high as 1.2975 on FXOpen.
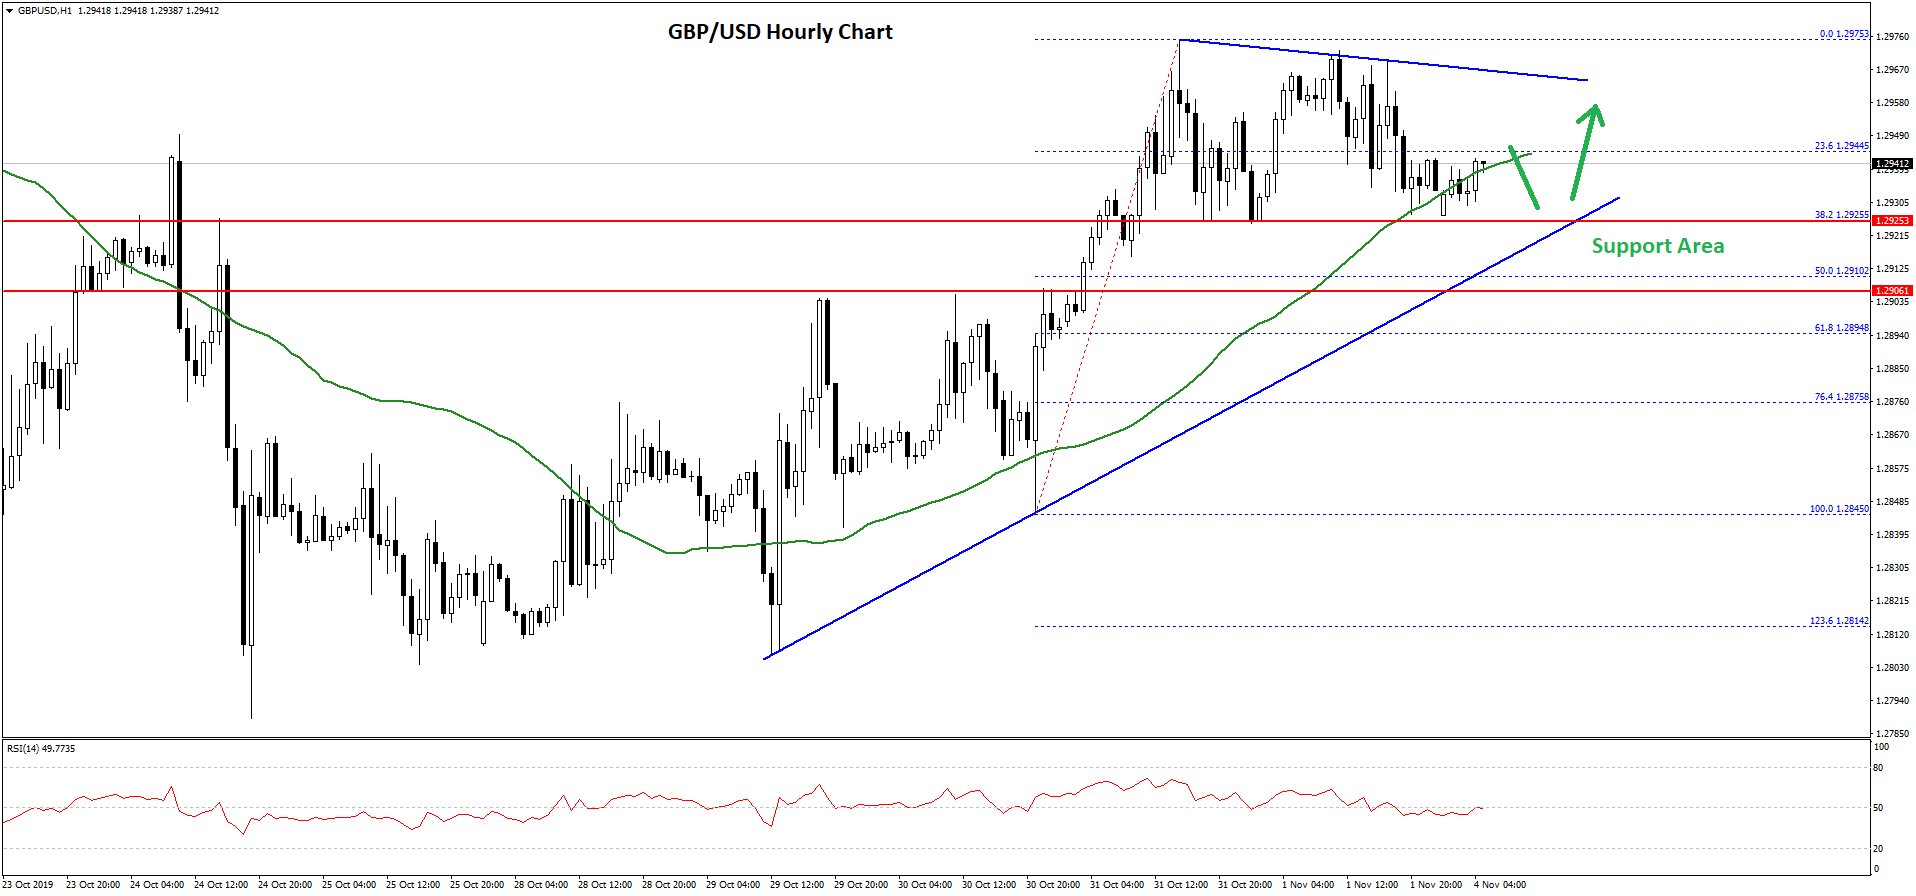
Recently, there was a minor downside correction below the 1.2950 level. The pair traded below the 23.6% Fib retracement level of the recent wave from the 1.2845 swing low to 1.2975 high.
However, the 1.2925 level is acting as a support and the pair is currently trading near the 50 hourly simple moving average. On the downside, there are many supports near the 1.2925 and 1.2920 levels.
Moreover, there is a connecting bullish trend line forming with support near 1.2920 on the hourly chart of GBP/USD. If there is a break below the trend, the pair could test the 1.2900 support area.
An intermediate support is near the 50% Fib retracement level of the recent wave from the 1.2845 swing low to 1.2975 high.
On the upside, an immediate resistance is near the 1.2970 level. If there is an upside break above 1.2970 and 1.2975, GBP/USD could accelerate above the 1.3000 resistance.
USD/CAD Technical Analysis
The US Dollar rallied sharply from the 1.3042 low against the Canadian Dollar. The USD/CAD pair traded above the 1.3100 and 1.3180 resistance levels to move into a positive zone.
However, the pair failed to surpass the 1.3200-1.3210 resistance and traded as high as 1.3207. Recently, it started a downside correction below the 1.3200 and 1.3180 levels.
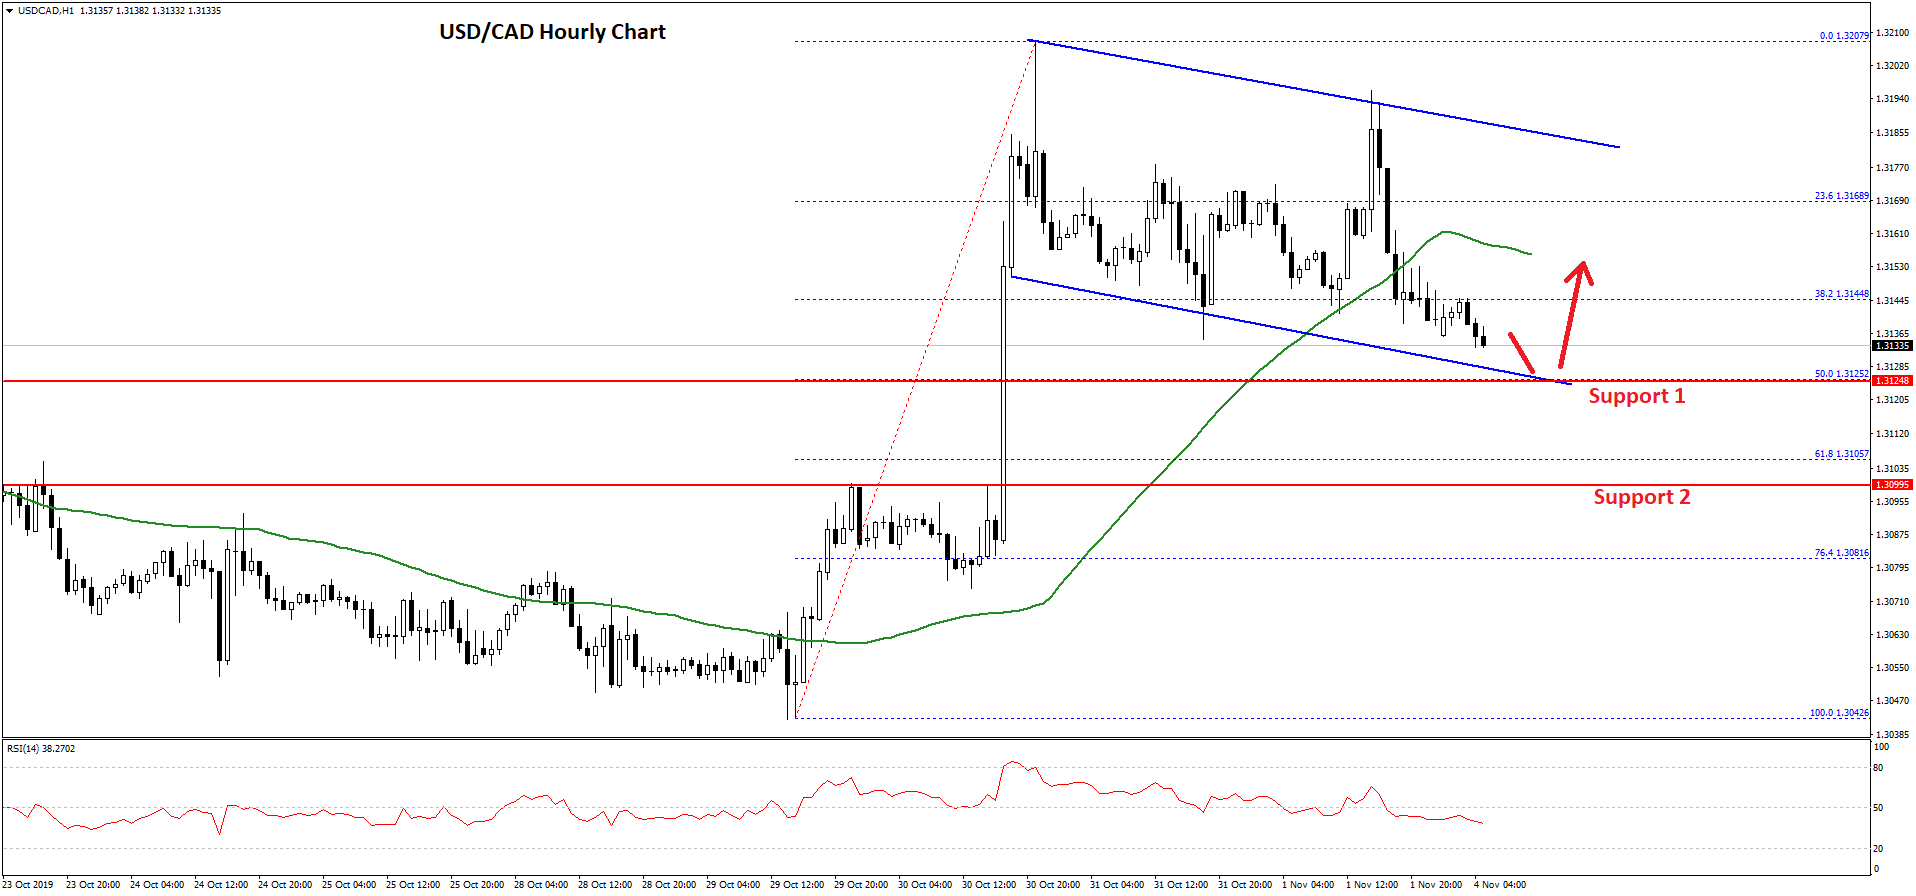
There was a break above the 1.3150 support level and the 50 hourly simple moving average. Additionally, the pair traded below the 23.6% Fib retracement level of the last wave from the 1.3042 swing low to 1.3207 high.
On the downside, there is a strong support waiting near the 1.3125 level. It coincided with the 50% Fib retracement level of the last wave from the 1.3042 swing low to 1.3207 high.
More importantly, there is a declining channel forming with support near 1.3125 on the hourly chart. If there is a downside break below the 1.3125 support area, there could be more downsides towards the 1.3100 support area.
Conversely, if there is an upward move, USD/CAD might face resistance near the 1.3150 level and the 50 hourly SMA. The main resistance on the upside is near the 1.3180 level, above which the pair could continue to rise towards 1.3200 and 1.3220 in the coming sessions.
Trade over 50 forex markets 24 hours a day with FXOpen. Take advantage of low commissions, deep liquidity, and spreads from 0.0 pips (additional fees may apply). Open your FXOpen account now or learn more about trading forex with FXOpen.
This article represents the opinion of the Companies operating under the FXOpen brand only. It is not to be construed as an offer, solicitation, or recommendation with respect to products and services provided by the Companies operating under the FXOpen brand, nor is it to be considered financial advice.
Stay ahead of the market!
Subscribe now to our mailing list and receive the latest market news and insights delivered directly to your inbox.


Latest articles

Apple: Earnings Day Above the Activity Zone
On 30 April, after the market close, Apple Inc. will release its financial results for the second quarter of fiscal 2026. The consensus forecast, based on estimates from 31 analysts, points to revenue of around $109.7 billion, with expected

USD/JPY and USD/CHF Near Key Levels: The Dollar Supported by the Fed
The US dollar continues to trend upwards following the Federal Reserve meeting, drawing support from the regulator’s moderately hawkish stance and comments by Jerome Powell. Markets interpret the Fed’s rhetoric as a signal that restrictive policy is likely

EUR/USD and GBP/USD consolidate ahead of the Fed decision
European currencies are showing subdued dynamics, entering a consolidation phase following their previous advance. Earlier, EUR/USD and GBP/USD broke out of their ranges and strengthened; however, the subsequent correction has led both pairs to retest the previously breached