GBP/USD Eyes More Upsides, EUR/GBP Holding Key Support
GBP/USD is showing positive signs above 1.3800 and 1.3780. EUR/GBP is showing bearish signs and it is testing a major support near 0.8640.
Important Takeaways for GBP/USD and EUR/GBP
- The British Pound started a decent increase from the 1.3720 support zone.
- There was a break above a key contracting triangle with resistance near 1.3780 on the hourly chart of GBP/USD.
- EUR/GBP failed to continue higher above 0.8720 and corrected lower.
- There was a break below a major contracting triangle with support near 0.8685 on the hourly chart.
GBP/USD Technical Analysis
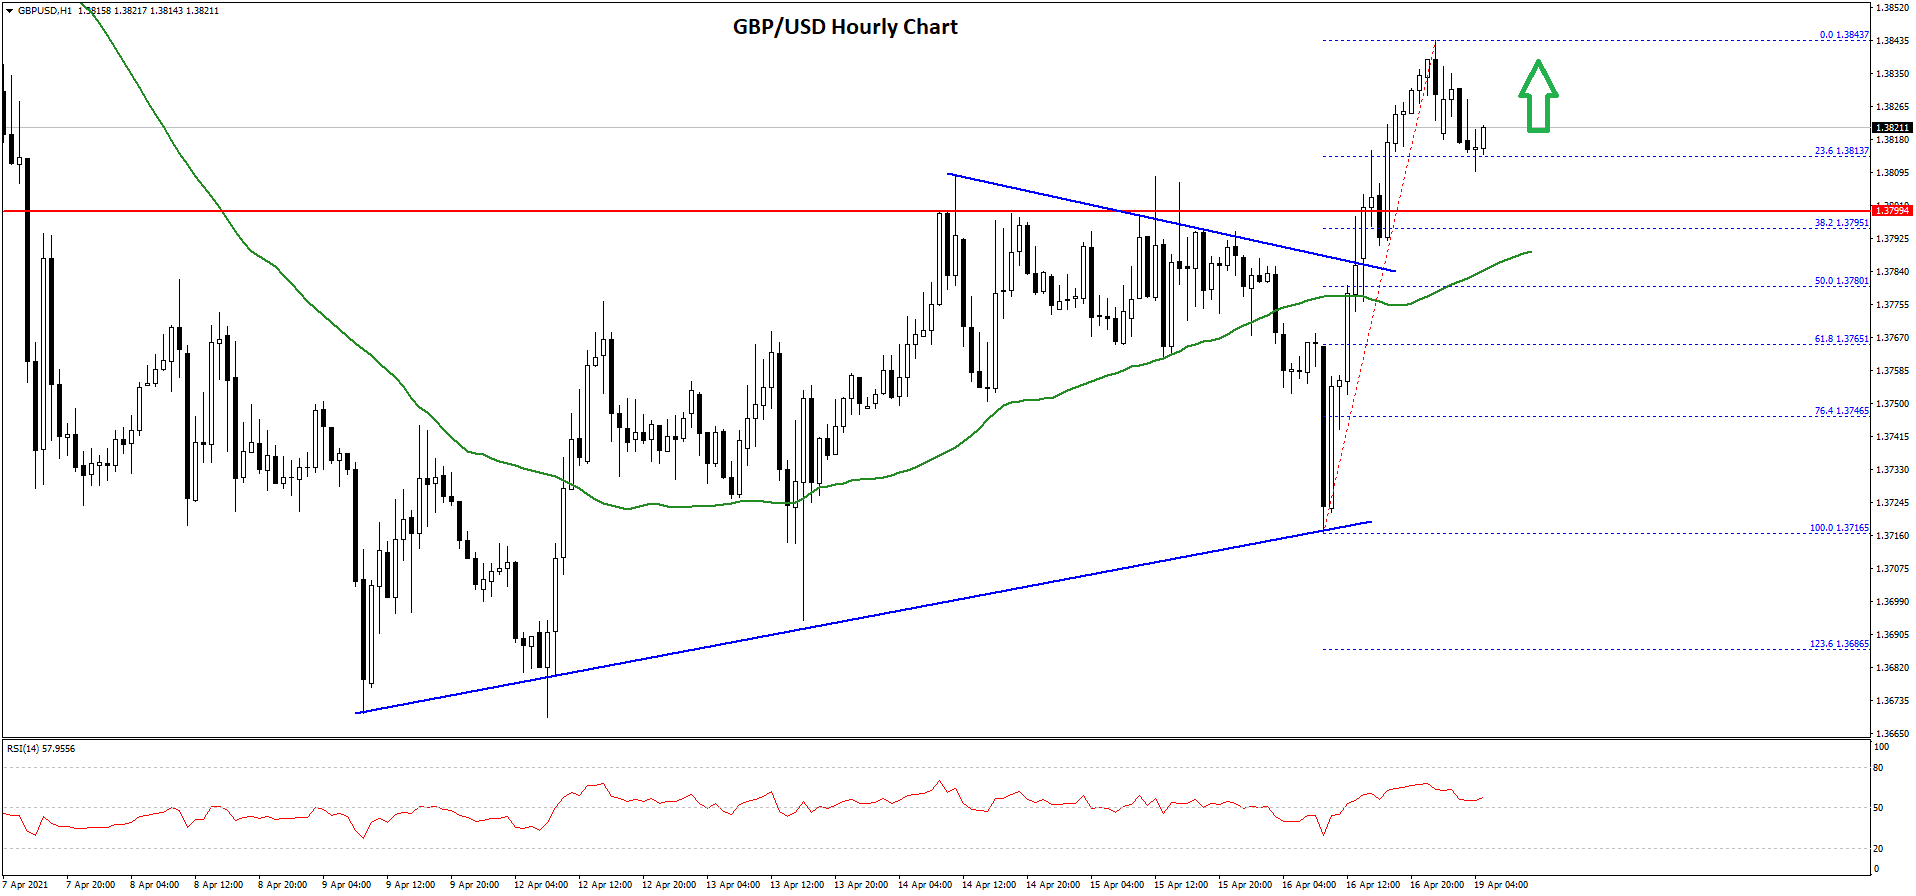
After forming a support base above 1.3700, the British Pound started a fresh increase against the US Dollar. The GBP/USD pair broke the 1.3750 and 1.3800 resistance levels to move into a positive zone.
There was also a close above the 1.3800 level and the 50 hourly simple moving average. During the increase, there was a break above a key contracting triangle with resistance near 1.3780 on the hourly chart of GBP/USD.
The pair climbed above the 1.3820 level and traded as high as 1.3843 on FXOpen. Recently, there was a downside correction from the 1.3843 high.
The pair tested the 23.6% Fib retracement level of the upward move from the 1.3716 swing low to 1.3843 high at 1.3813. The next major support on the downside is near the 1.3800 zone (the recent breakout zone).
Any more losses could initiate a drop towards the 1.3780 support or the 50 hourly simple moving average. The 50% Fib retracement level of the upward move from the 1.3716 swing low to 1.3843 high is also near the 1.3780 level.
On the upside, the 1.3840 and 1.3850 levels are immediate hurdles. A successful break above 1.3850 might clear the path for more gains above the 1.3880 and 1.3900 levels.
EUR/GBP Technical Analysis
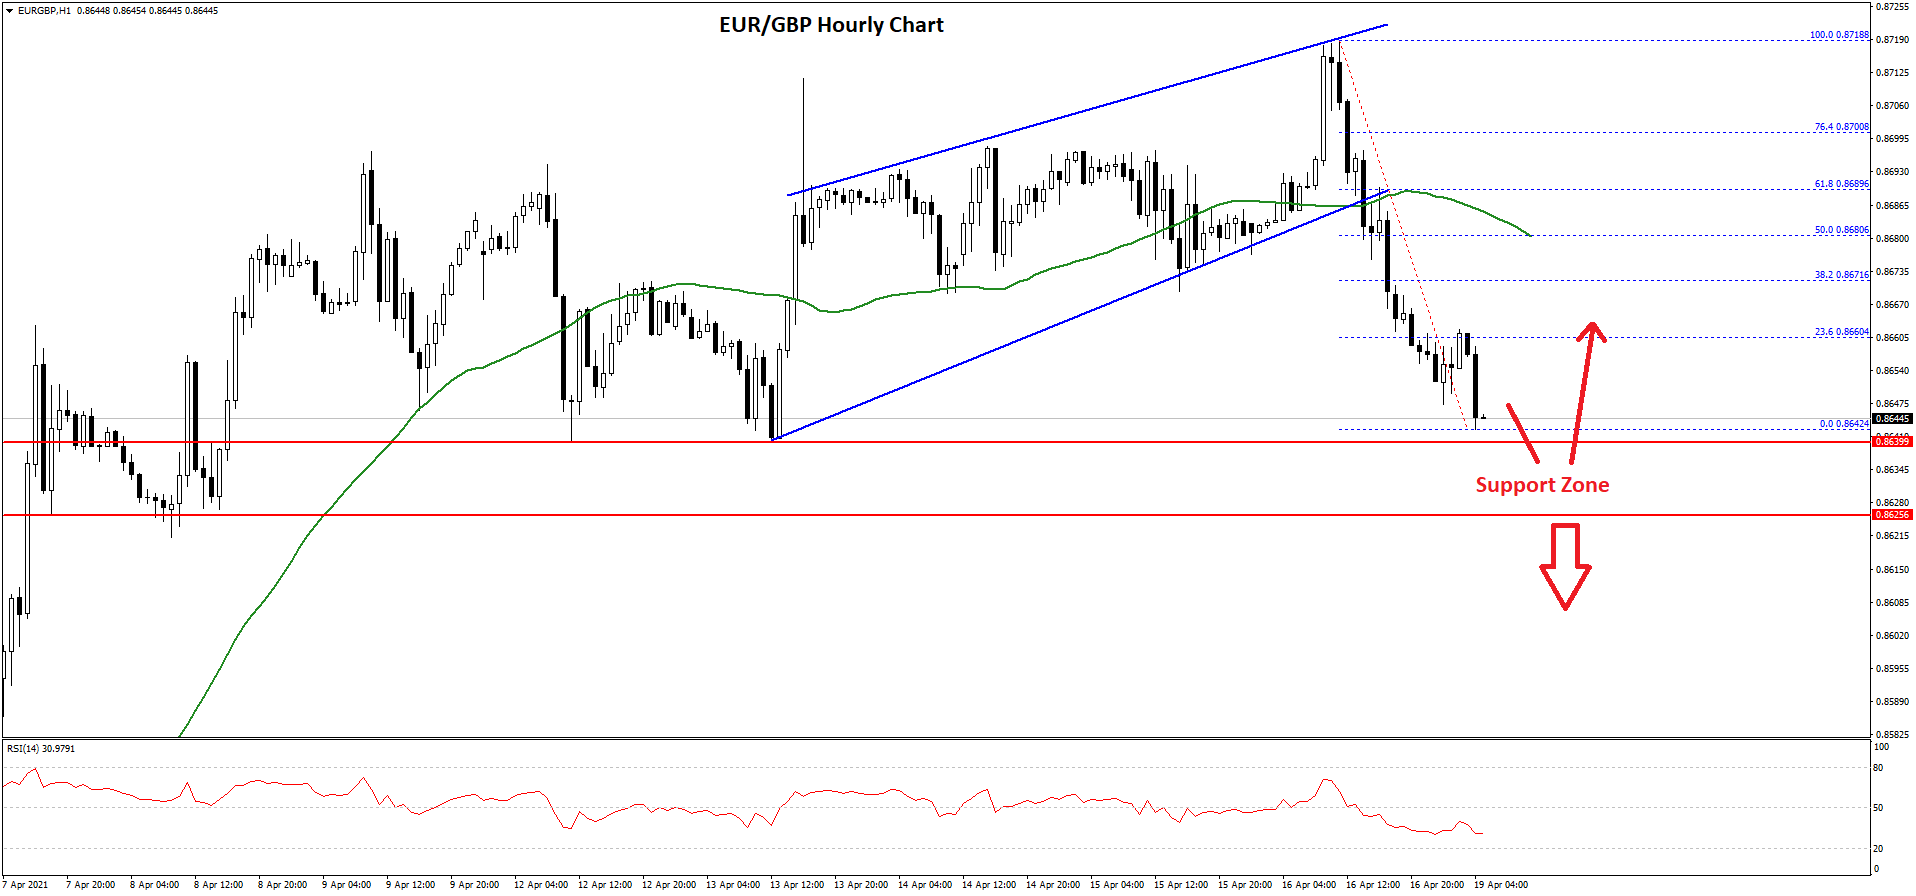
The Euro remained steady above the 0.8640 level against the British Pound. The EUR/GBP pair climbed higher above the 0.8700 level, but it struggled to continue higher.
It traded as high as 0.8718 before the bears took a stand. As a result, there was a bearish reaction below the 0.8700 and 0.8680 support levels. There was also a break below a major contracting triangle with support near 0.8685 on the hourly chart.
The pair settled below the 0.8680 level and the 50 hourly simple moving average. A low is formed near 0.8642 and the pair is now consolidating losses.
An initial resistance on the upside is near the 0.8660 level. It is near the 23.6% Fib retracement level of the recent decline from the 0.8718 swing high to 0.8642 low. The next major resistance on the upside is near the 0.8680 level.
The 50% Fib retracement level of the recent decline from the 0.8718 swing high to 0.8642 low is near the 0.8680 level. Moreover, the 50 hourly simple moving average is also near 0.8680.
If there is an upside break above 0.8680, the pair could start a fresh increase above 0.8700. In the stated case, there are chances of a move towards the 0.8750 level.
On the downside, the 0.8640 level is a key support. A proper close below the 0.8640 level may possibly put a lot of pressure on EUR/GBP and it could even decline towards 0.8600.
This forecast represents FXOpen Markets Limited opinion only, it should not be construed as an offer, invitation or recommendation in respect to FXOpen Markets Limited products and services or as financial advice.