


FXOpen
GBP/USD started a fresh decline from the 1.2165 resistance. EUR/GBP declined heavily and tested the 0.8440 support zone.
Important Takeaways for GBP/USD and EUR/GBP
· The British Pound started a fresh decline from the 1.2165 zone against the US Dollar.
· There is a key bullish trend line forming with support near 1.1960 on the hourly chart of GBP/USD.
· EUR/GBP declined below the 0.8550 and 0.8500 support levels .
· There is a major bearish trend line forming with resistance near 0.8480 on the hourly chart.
GBP/USD Technical Analysis
The British Pound failed to gain strength above the 1.2200 level against the US Dollar. The GBP/USD pair started a fresh decline below the 1.2150 and 1.2120 support levels.
There was a clear move below the 1.2000 support level and the 50 hourly simple moving average. The bears even pushed the pair below the 1.1950 level. A low was formed near 1.1875 on FXOpen the pair is now correcting losses.
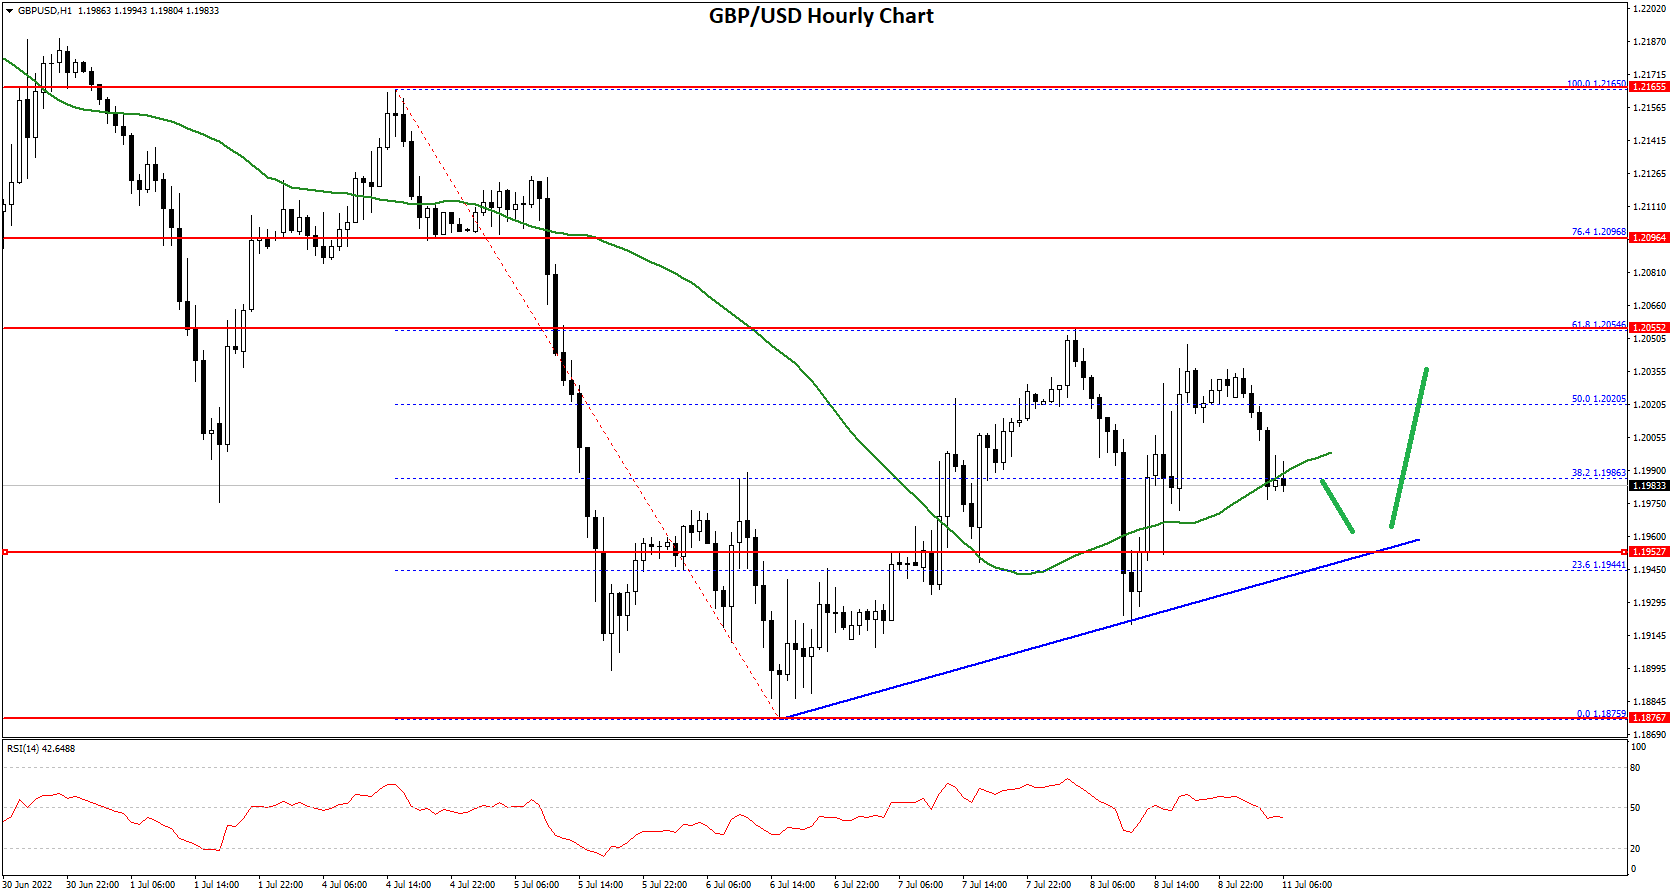
There was a move above the 1.1950 and 1.2000 resistance levels. The pair even climbed above the 50% Fib retracement level of the downward move from the 1.2165 swing high to 1.1875 low.
However, the pair faced sellers near the 1.2050 level. It struggled near the 61.8% Fib retracement level of the downward move from the 1.2165 swing high to 1.1875 low. On the upside, an initial resistance is near the 1.2020 level.
The next main resistance is near the 1.2050 zone. A clear upside break above the 1.2020 and 1.2050 resistance levels could open the doors for a steady increase in the near term. The next major resistance sits near the 1.2165 level.
If not, the pair might start a fresh decline below 1.1980. There is also a key bullish trend line forming with support near 1.1960 on the hourly chart of GBP/USD. The next major support is near the 1.1920 level. Any more losses could lead the pair towards the 1.1875 support zone or even 1.1800.
EUR/GBP Technical Analysis
The Euro struggled to continue higher above the 0.8680 level against the British Pound. The EUR/GBP pair started a fresh decline and traded below the 0.8550 support.
The pair even traded below the 0.8500 level and the 50 hourly simple moving average. It traded as low as 0.8440 and is currently attempting an upside break. The pair is now facing resistance near the 0.8480 level and the 50 hourly simple moving average.
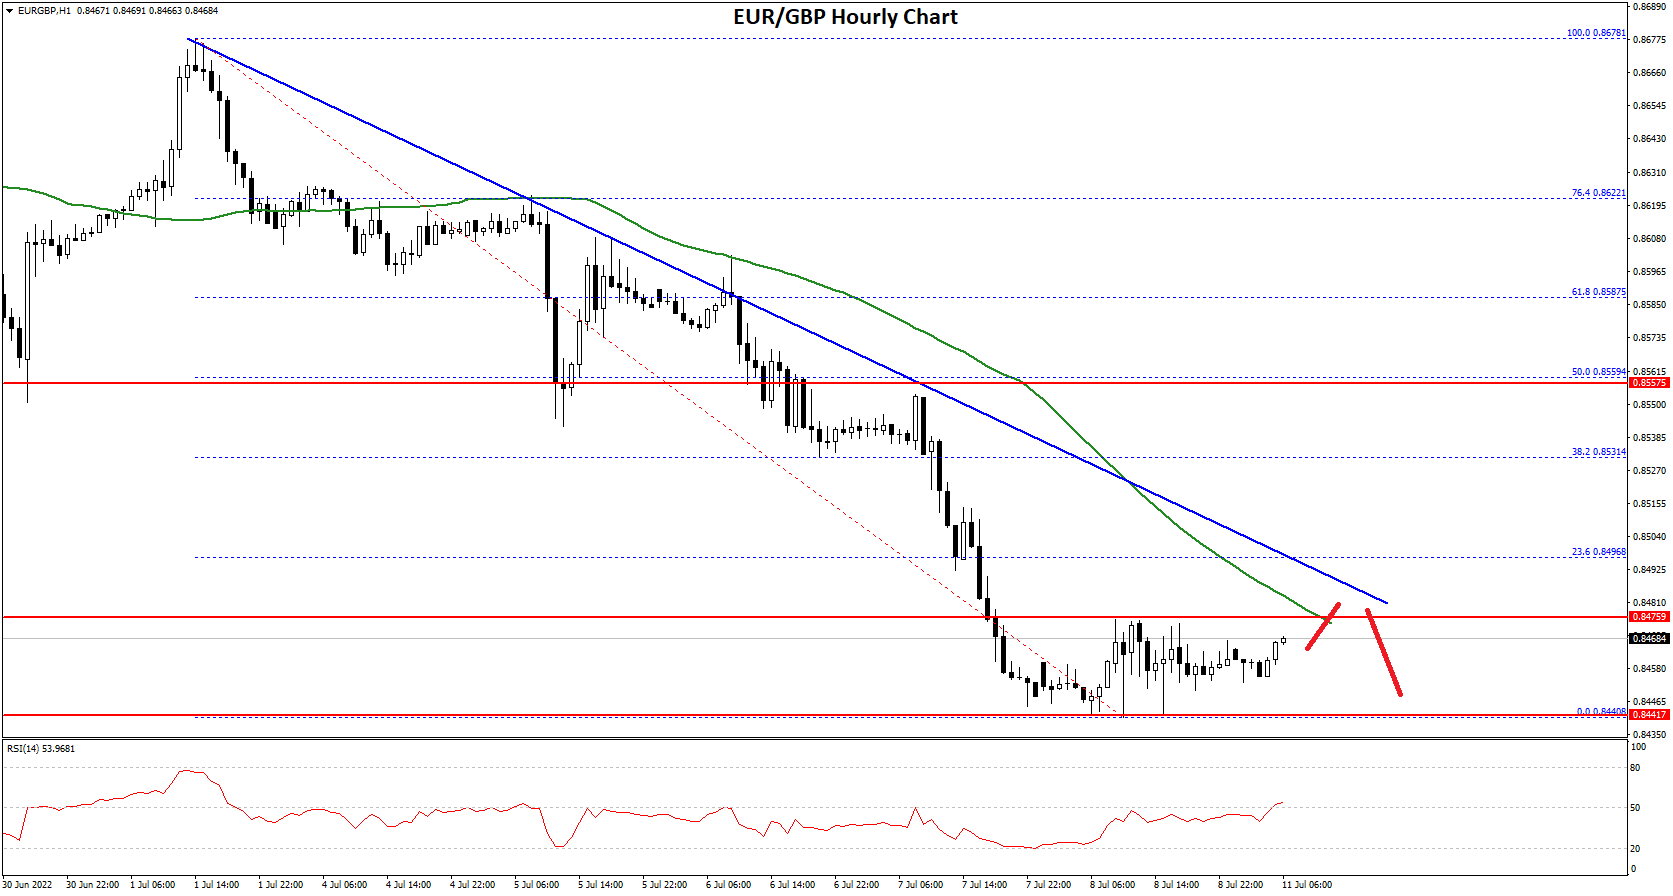
There is also a major bearish trend line forming with resistance near 0.8480 on the hourly chart. The trend line is close to the 23.6% Fib retracement level of the key decline from the 0.8678 high to 0.8440 low.
The next major resistance for the bulls is near the 0.8560 level. It is near the 50% Fib retracement level of the key decline from the 0.8678 high to 0.8440 low. A clear move above the 0.8560 resistance might push the price higher.
On the downside, an initial support is near the 0.8450 level. The next major support is near 0.8440. A downside break below the 0.8440 support might call for more downsides. In the stated case, the pair could decline towards the 0.8400 support level in the near term.
This forecast represents FXOpen Markets Limited opinion only, it should not be construed as an offer, invitation or recommendation in respect to FXOpen Markets Limited products and services or as financial advice.
Trade over 50 forex markets 24 hours a day with FXOpen. Take advantage of low commissions, deep liquidity, and spreads from 0.0 pips (additional fees may apply). Open your FXOpen account now or learn more about trading forex with FXOpen.
This article represents the opinion of the Companies operating under the FXOpen brand only. It is not to be construed as an offer, solicitation, or recommendation with respect to products and services provided by the Companies operating under the FXOpen brand, nor is it to be considered financial advice.
Stay ahead of the market!
Subscribe now to our mailing list and receive the latest market news and insights delivered directly to your inbox.


Latest articles


Market Analysis: AUD/USD And NZD/USD Turn Bullish, Is Rally Set to Extend?
AUD/USD started a fresh increase above 0.6970 and 0.7000. NZD/USD is also rising and might aim for more gains above 0.5850.
Important Takeaways for AUD USD and NZD USD Analysis Today
· The Aussie Dollar started

FOMC Minutes in Focus: USD/JPY and USD/CAD Pull Back from Highs
The US dollar has shifted into a corrective phase following its previous rally, while market participants adopt a wait-and-see approach ahead of the release of the Federal Reserve’s meeting minutes. The weakening of the dollar has already led to