GBP/USD Continues Record Breaking Losing Streak
As opposed to the expectations developed by the emergence of hammer on the daily chart, the cable inched lower against the greenback on Monday, taking the price to less than 1.5620. Opened at 1.5679, the price surged as high as 1.5735 during the early Asian session but then dragged down as the dollar gained momentum.
Technical Analysis
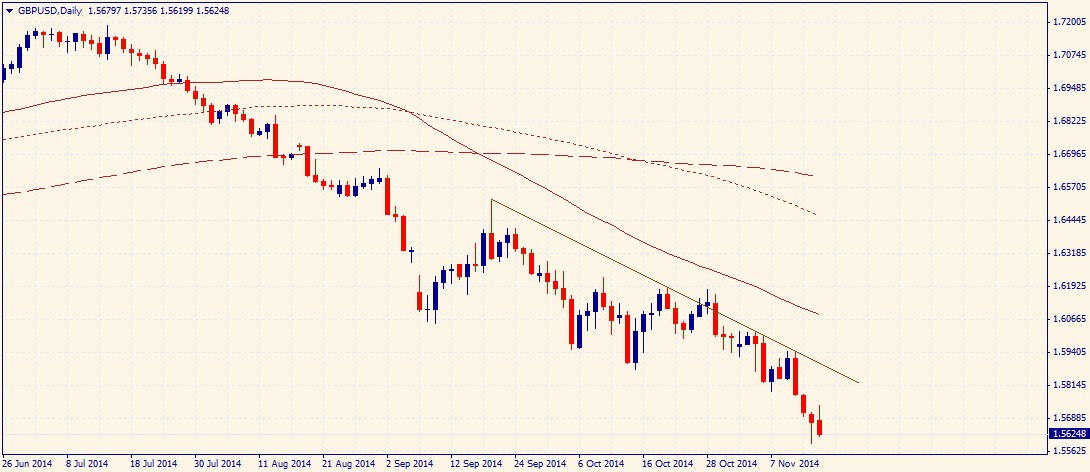
As of this writing, the pair is being traded around 1.5624, moving down to test the 1.5590 support–a psychological number and multi-month low. The next support is a moderate one which lies around 1.5470. The said level acted as a support on various occasions from July 2013 to August 2013.The pair may test this level during the next couple of days.
On the upside, the pair will face a hurdle around 1.5940, as demonstrated by the trend line in the above chart. The entire 1.5940-1.5960 zone is an important horizontal level. The next resistance lies around 1.6000, the psychological number.
The overall bias is bearish because of the Lower Low on the daily chart. The bias will remain bearish as long as the support around 1.5590 remains intact.
Industrial production
The US industrial production figure is expected to stay at 0.2%, worse than 1% in the month before, the median projection of different economists says. Generally speaking, a lower reading is considered negative for the US economy thus a better than expected figure might accelerate the bearish pressure in the price of GBP/USD.
Capacity Utilization
The US capacity utilization remained at 79.3%, same as that of the month before, says the average forecast of different analysts. As an indicator of growth and demand, a higher reading is considered bearish for the GBP/USD. Thus, a worse than expected figure might spur bullish momentum in the price of GBP/USD.
Trade Idea
As per technical and fundamental outlook, buying the pair could be a good strategy in short to medium term if the price leaves a bullish pin bar or bullish engulfing candle on the daily chart.