GBP/USD Turned Bearish and AUD/USD Struggling Near 0.7535
GBP/USD struggled this past week and declined below the 1.3500 and 1.3455 support levels to move into a bearish zone. On the other hand, AUD/USD is moving higher, but it is currently struggling to clear the 0.7535/40 resistance.
Important Takeaways for GBP/USD and AUD/USD
- The British Pound is currently under pressure and it could test 1.3400.
- Resistances on the upsides are seen at 1.3450, 1.3490 and 1.3525.
- Upsides in AUD/USD are capped near a bearish trend line with resistance at 0.7535 on the hourly chart.
- The Rightmove House Price Index in the UK increased 0.8% (MoM) in May 2018, more than the last +0.4%.
GBP/USD Technical Analysis
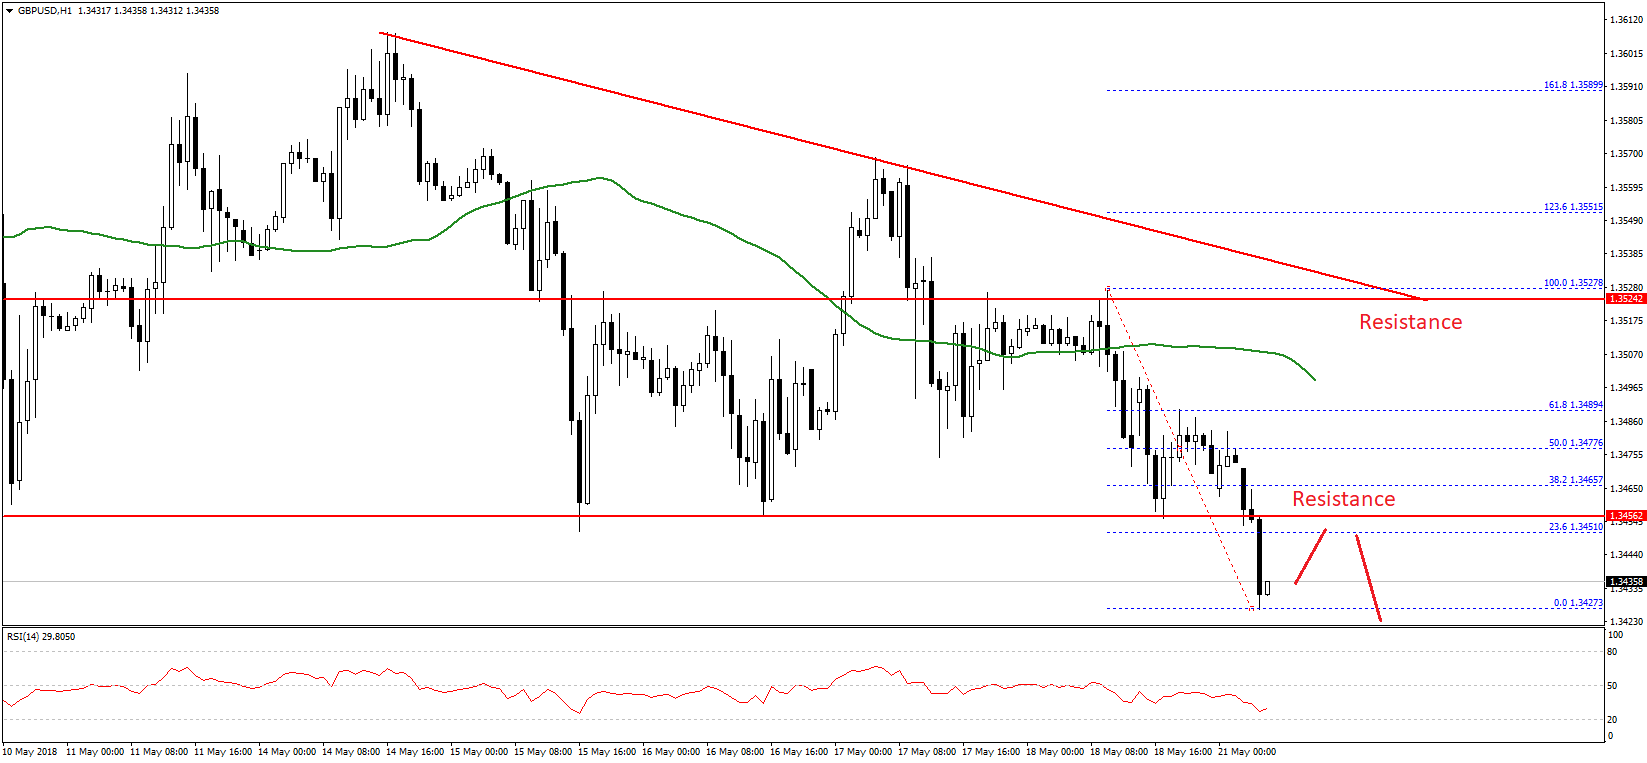
The British Pound started a major downside move from well above 1.3550 against the US Dollar. The greenback buyers took control this past week, which pushed the GBP/USD pair below the 1.3520, 1.3500 and 1.3455 support levels.
It recently traded as low as 1.3427 and is currently consolidating losses. An initial resistance is near the 23.6% Fib retracement level of the last decline from the 1.3527 high to 1.3427 low at 1.3450. The stated 1.3450 resistance zone was a support earlier and now it will most likely act as a strong hurdle for buyers.
To the topside, there is a bearish trend line on the hourly chart with resistance at 1.3520. Furthermore, an intermediate resistance is near the 50 hourly SMA and the 61.8% Fib retracement level of the last decline from the 1.3527 high to 1.3427 low at 1.3490.
Therefore, if GBP/USD corrects higher from the current levels, it is likely to face resistance near 1.3450 or 1.3490/50. Supports on the downside are at 1.3425 and 1.3400. Below 1.3400, the pair may well accelerate losses towards the 1.3360 support.
Fundamentally, the Rightmove House Price Index in the UK for May 2018 was published today. The market was looking for a rise of 0.5% in the index in May 2018, compared with the previous month.
However, the outcome was on the higher side as there was a rise of 0.8% in the index. The yearly change in the index was +1.1% in May 2018, which was a less than the last +1.0%.
AUD/USD Technical Analysis
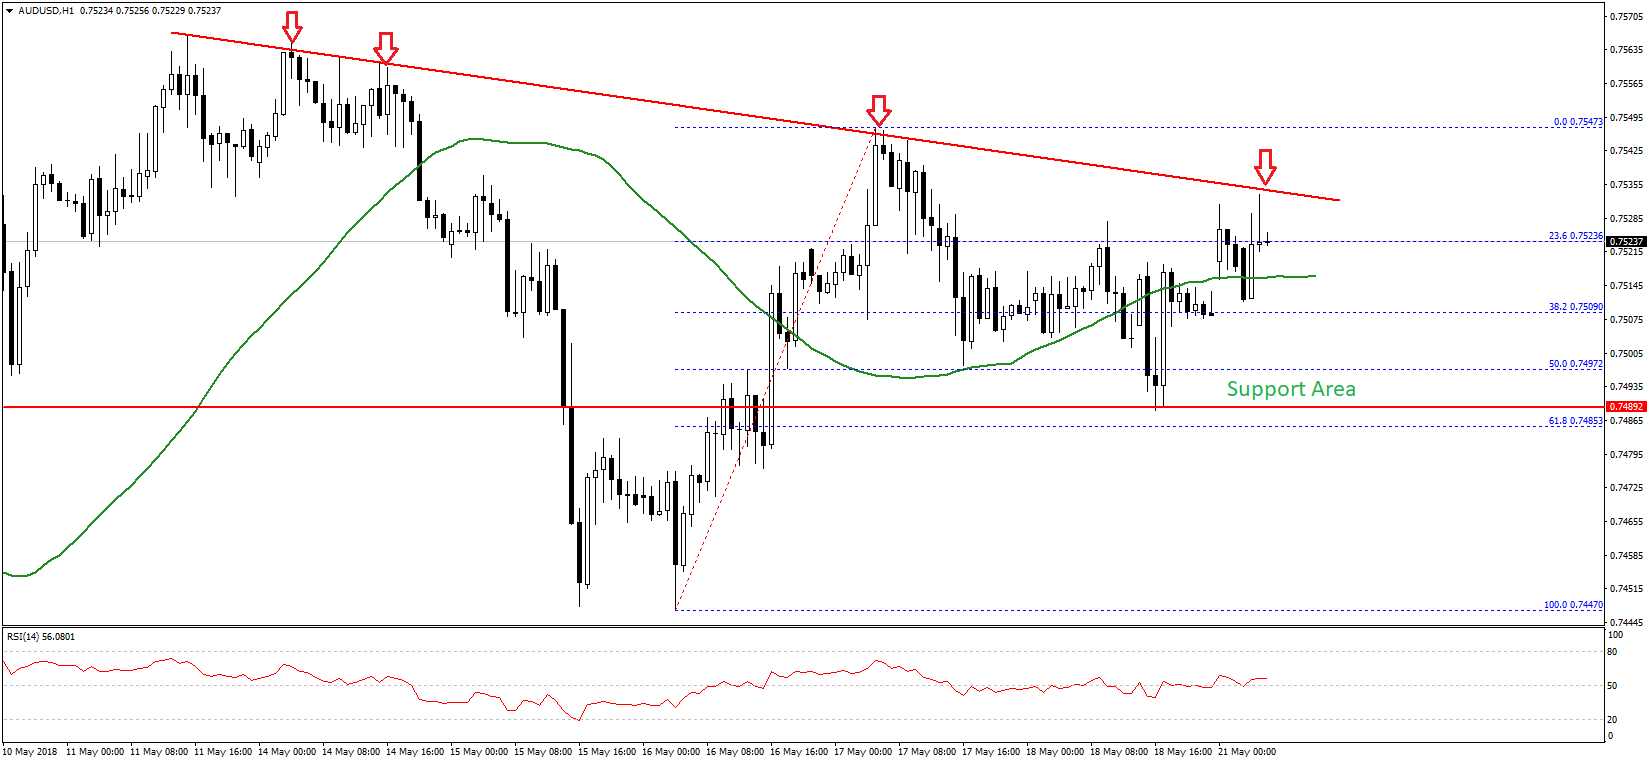
The Aussie Dollar managed to recover recently after it formed a support base near 0.7450 against the US Dollar. The AUD/USD climbed higher and settled above the 0.7500 resistance level.
However, the pair is currently struggling near a bearish trend line with resistance at 0.7535 on the hourly chart. A break above the trend line resistance and 0.7540 is must for more gains towards 0.7550 and 0.7580 in the short term.
Should the pair fails to move above 0.7540, it may correct lower towards the 0.7500 support. However, the most important support is near the 50% Fib retracement level of the last wave from the 0.7447 low to 0.7547 high.
The overall bias is positive as long as AUD/USD is above 0.7490, but it won’t be easy for buyers to break the 0.7540 resistance. In the short term, there could be ranging moves before the pair makes the next move either above 0.7540 or below 0.7500.