Gold and Crude Oil Buyers Face Uphill Task
Gold price is correcting higher, but it is facing a major resistance near $1,248. Crude oil price is under pressure, and on the upside, there are key resistances near $70.25 and $70.70.
Important Takeaways for Gold and Oil
- Gold price declined this week and settled below the $1,250 support against the US Dollar.
- There is a crucial bearish trend line formed with resistance near $1,247-48 on the hourly chart of gold.
- Crude oil price is likely to face many resistances on the upside like $70.25 and $70.70.
- China’s Trade Balance in June 2018 posted a surplus of $41.60B, well above the forecast of $27.61B.
Gold Price Technical Analysis
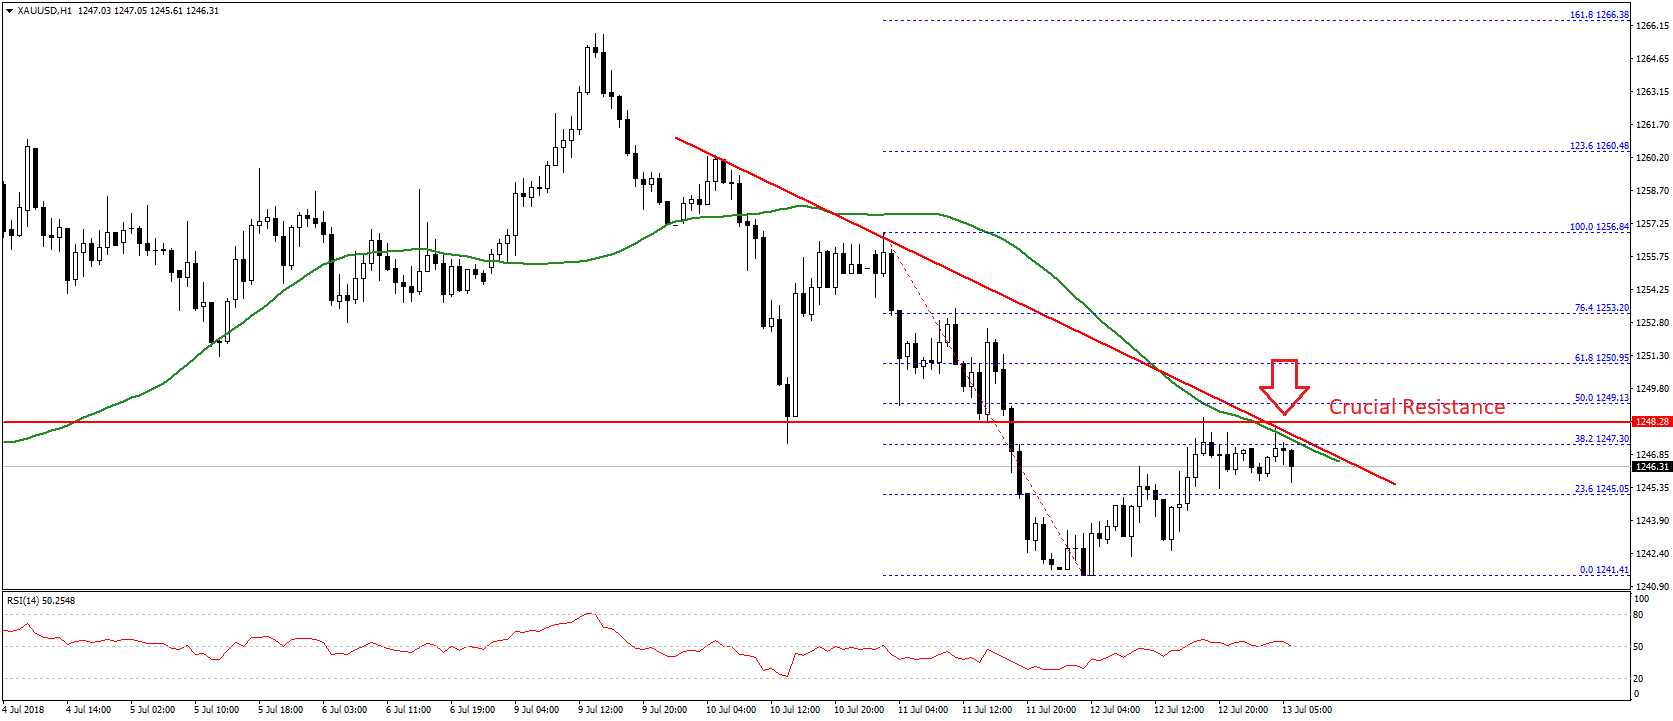
Gold price remained in a downtrend this week from well above the $1,260 pivot level against the US Dollar. The price declined and broke many supports such as $1,254 and $1,250.
It traded towards the $1,240 level and formed a low near $1,241. It is currently correcting higher and it already moved above the $1,244 resistance. It also broke the 23.6% Fib retracement level of the last decline from the $1,256 high to $1,241 low.
However, there is a significant resistance formed near $1,248 and the 50 hourly simple moving average. There is also a crucial bearish trend line formed with resistance near $1,247-47 on the hourly chart of gold.
The trend line resistance is positioned just below the 50% Fib retracement level of the last decline from the $1,256 high to $1,241 low. Therefore, a break and close above $1,248-50 won’t be easy. If buyers succeed, the price could move back in a bullish zone towards the next resistance at $1,255.
On the flip side, if the $1,248 resistance and 50 hourly SMA continue to prevent upsides, the price may perhaps drop again and resume its downtrend. Supports on the downside are seen near $1,244 and $1,241.
Oil Price Technical Analysis
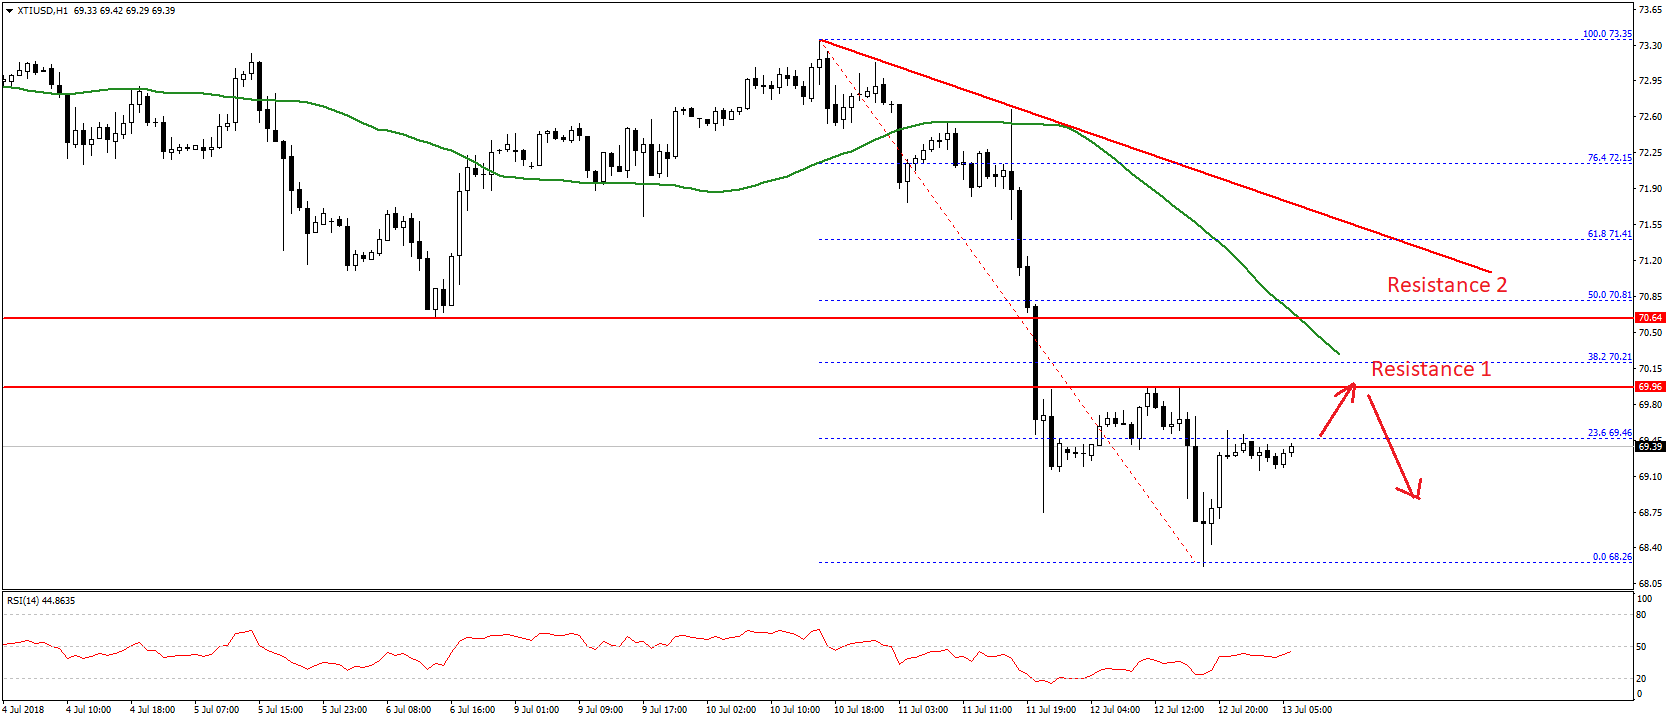
Crude oil price dropped heavily during the past three days after setting a short-term top near the $73.35 level against the US Dollar. The price declined and broke supports like $72.50, $71.00 and $70.00 to settle below the 50 hourly simple moving average.
The decline was such that the price traded close to the $68.00 level and formed a low at $68.26. Later, the price started an upside correction and moved above $69.00.
At the moment, it is testing the 23.6% Fib retracement level of the last drop from the $73.35 high to $68.26 low. Above this, there are many resistances on the upside near the $70.25 level and the 50 hourly SMA.
There is also a key bearish trend line with resistance at $70.80 on the hourly chart. It coincides with the 50% Fib retracement level of the last drop from the $73.35 high to $68.26 low. Moreover, the 50 hourly SMA is positioned near $70.30.
Therefore, it seems like there are many hurdles for buyers above the $70.25 level up to $70.80. As long as the price is below $71.00, it remains in a downtrend. Supports are seen near $69.00 and $68.20.
Recently in China, the Trade Balance figures for June 2018 were published. The market was looking for a trade surplus of around $27.61B, but the result was positive since there was a surplus of $41.60B.
It could help gold price in gaining traction, but a break above the mentioned $1,248 resistance won’t be easy in the near term.