Gold And Crude Oil Price Trimming Gains After US-Iran Tension Ease
Gold price started a downside correction after a massive upward move above $1,600. Crude oil price also declined and trimmed most gains below the $62.20 support area.
Important Takeaways for Gold and Oil
- Gold price rallied above the $1,600 level before it started a strong decline against the US Dollar.
- There was a break below a major bullish trend line with support near $1,575 on the hourly chart of gold.
- Crude oil price failed to stay above the $65.00 level and declined heavily.
- There was a break below a key bullish trend line with support near $62.55 on the hourly chart of XTI/USD.
Gold Price Technical Analysis
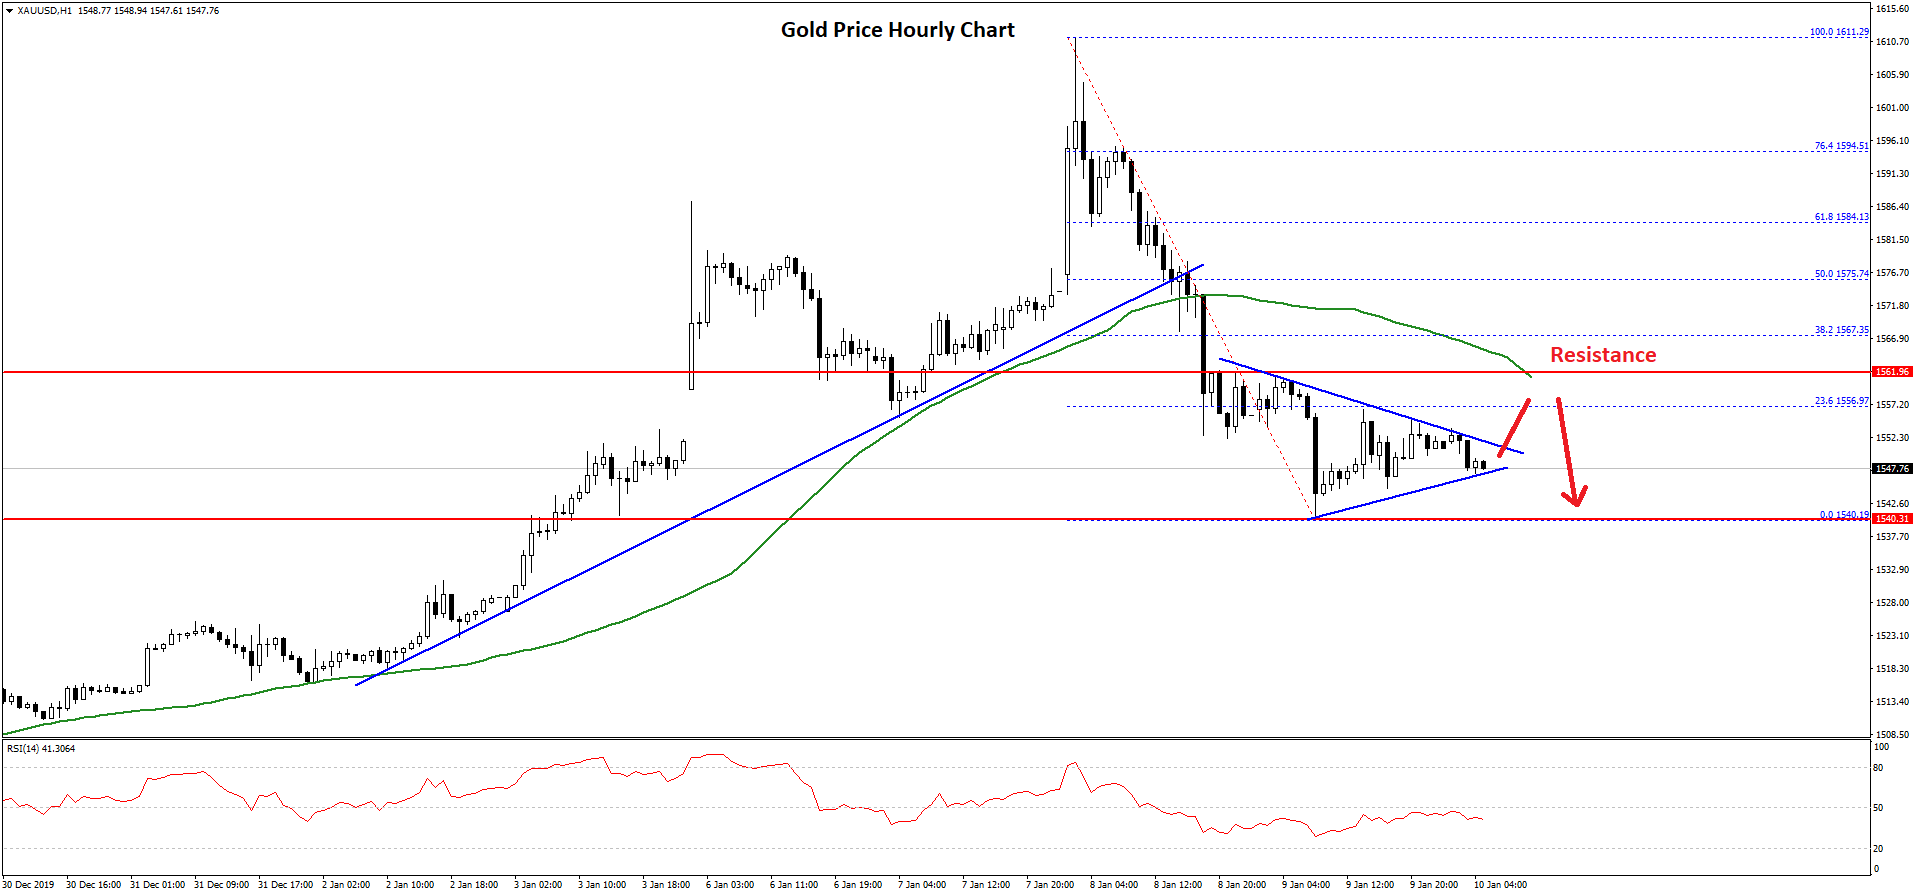
Earlier this month, gold price started a strong rise above the $1,555 and $1,575 resistance levels against the US Dollar, due to tensions between the USA and Iran. Recently, tension eased which resulted in a sharp downside correction from well above $1,600.
A high was formed near $1,611 on FXOpen before the price declined heavily. There a clear break below the $1,580 support area and the 50 hourly simple moving average.
Moreover, there was a break below a major bullish trend line with support near $1,575 on the hourly chart of gold. The price even broke the $1,550 support and tested the $1,540 area.
It is currently consolidating and trading near $1,547. On the upside, the first resistance is near the $1,555 level or the 23.6% Fib retracement level of the recent decline from the $1,611 high to $1,540 low.
The main hurdle is near the $1,560 area and the 50 hourly simple moving average. If there is a clear break above $1,560, the price could rise towards the $1,575 level.
The 50% Fib retracement level of the recent decline from the $1,611 high to $1,540 low is at $1,575 to protect gains. Any further upside may perhaps lead the price towards the $1,600 area.
Conversely, a downside break below the $1,545 and $1,540 support levels might push gold price towards the $1,520 support.
Oil Price Technical Analysis
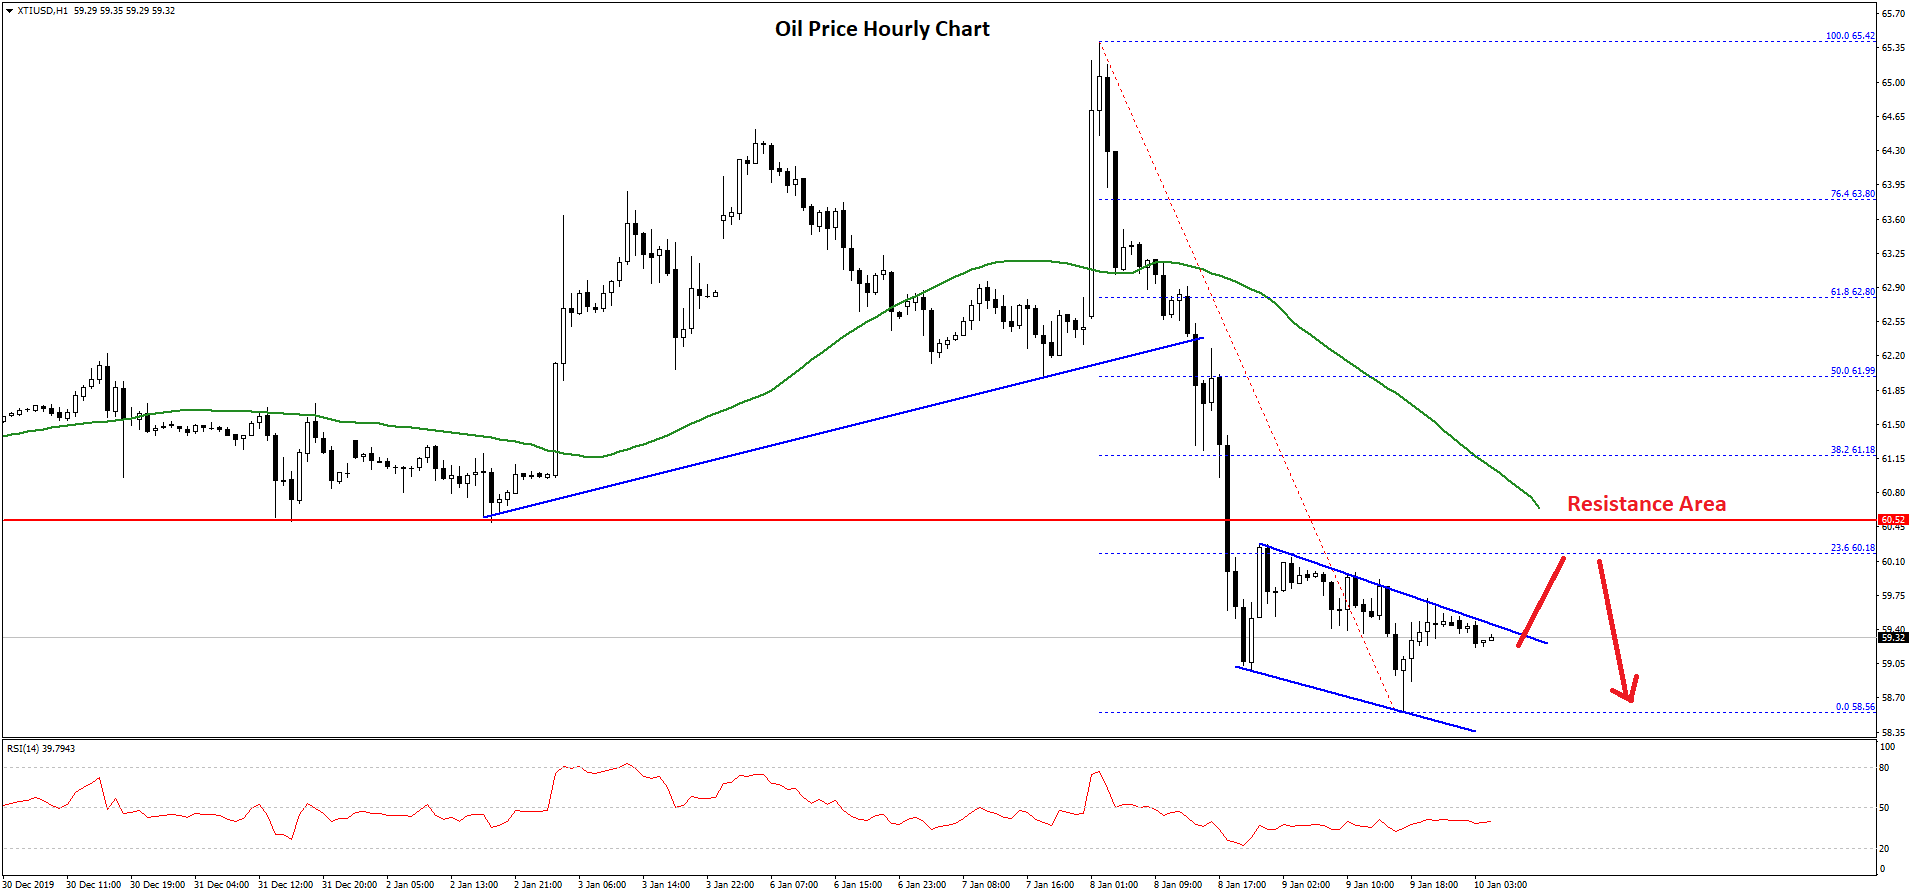
A similar price action was observed for crude oil price as it started a sharp decline from well above $65.00 against the US Dollar. The price trimmed most gains and declined below the $62.20 support.
Besides, there was a break below a key bullish trend line with support near $62.55 on the hourly chart of XTI/USD. The price settled below the $62.00 area and the 50 hourly simple moving average.
Finally, there was a break below the $60.00 support and a low is formed near $58.56. It is currently correcting higher above the $59.00 level.
It seems like a declining channel is forming with resistance near $59.40. If there is an upside break above $59.40, the price could test the 23.6% Fib retracement level of the recent decline from the $65.42 high to $58.56 low at $60.18.
Besides, the $60.50 area is a strong resistance since it is near the 50 hourly simple moving average. The next hurdle is near the 50% Fib retracement level of the recent decline from the $65.42 high to $58.56 low at $61.99.
Any further gains above the $62.00 level might lead the price towards the $65.00 area. Conversely, crude oil price could continue to decline below $59.00. The next major supports are $58.00 and $56.50.