Gold and Oil Price Remains Supported on Dips
Gold price is following an uptrend above the $1,200 support. Similarly, dips in crude oil price remains supported near the $69.80 and $69.50 levels.
Important Takeaways for Gold and Oil
- Gold price is trading with a bullish bias above the $1,200 support area against the US Dollar.
- There is a crucial ascending channel forming with support at $1,204 on the hourly chart of gold.
- Crude oil price climbed above the $71.00 level recently and is currently correcting lower.
- There are two bullish trend lines in place with support at $70.00 and $69.20 on the hourly chart of XTI/USD.
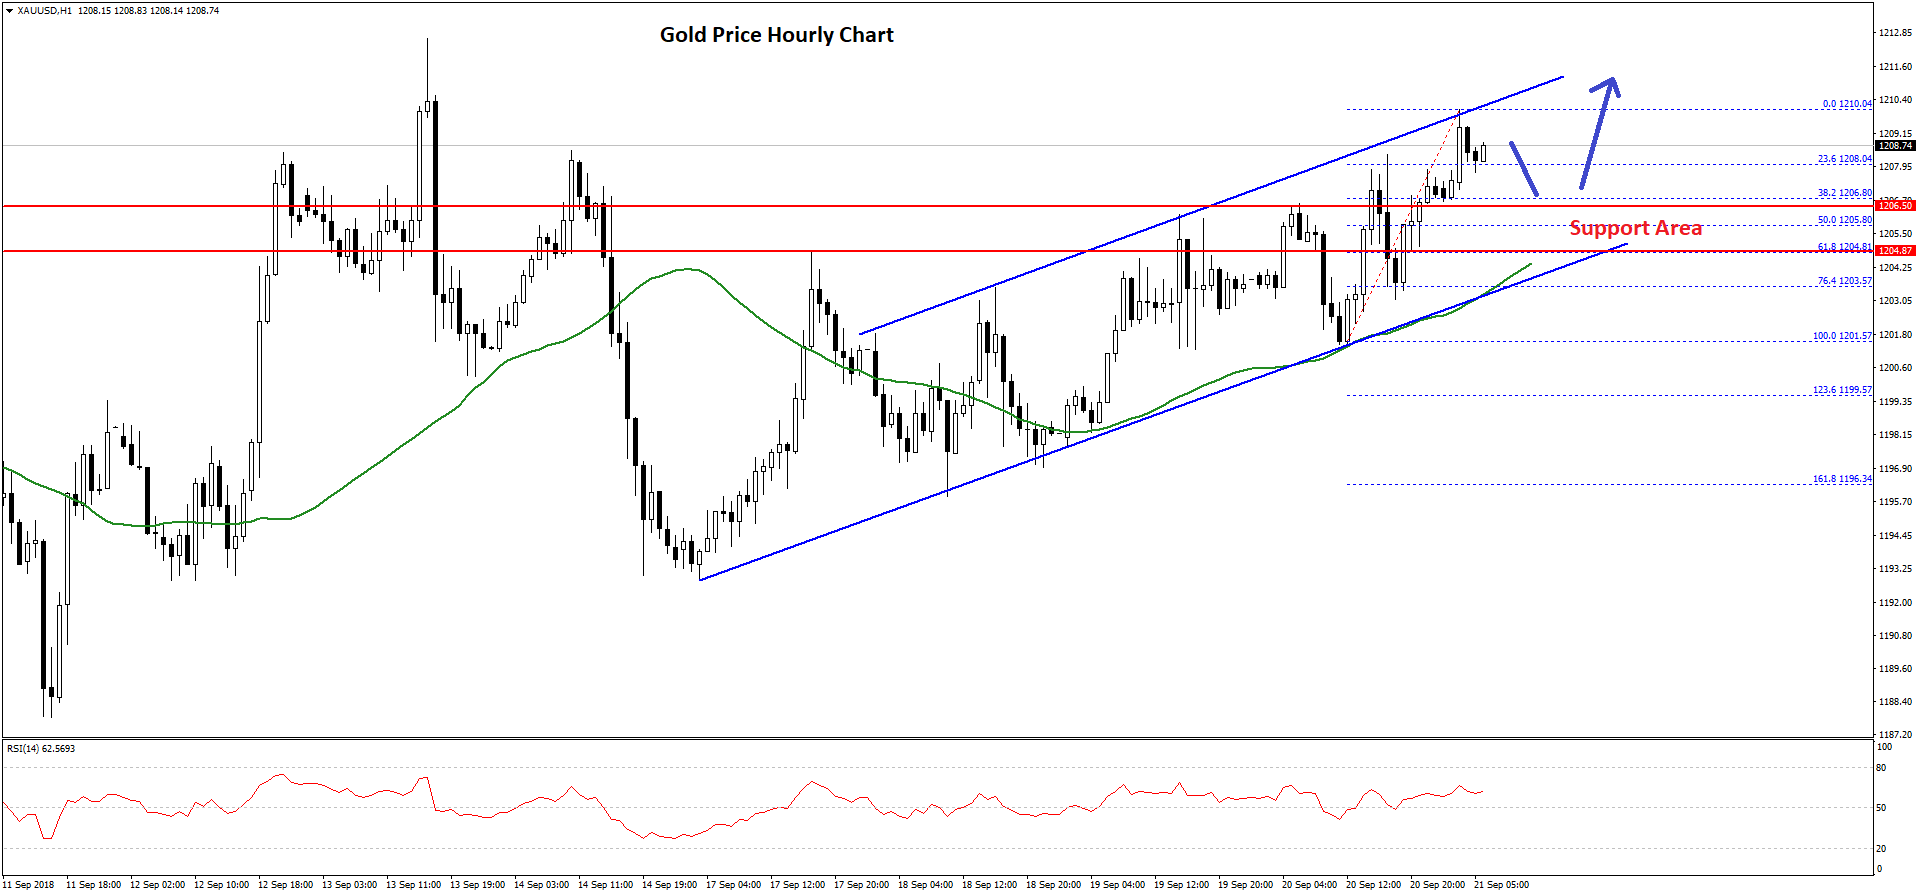
Gold Price Technical Analysis
Gold price was rejected on a couple of occasions near the $1,194-1,195 support zone against the US Dollar. The price formed a base and later started an upside move above the $1,200 resistance.
There was a nice upside move and the price even broke the $1,205 resistance and the 50 hourly simple moving average. The price traded towards the $1,210 level and formed a high at $1,210.04.
Later, there was a downside correction and the price tested the 23.6% Fib retracement level of the last wave from the $1,201 low to $1,210 high. The current price action is positive and any dips from the current levels towards the $1,205 level remains supported.
There is also a crucial ascending channel forming with support at $1,204 on the hourly chart of gold. Above the channel support, the 50% Fib retracement level of the last wave from the $1,201 low to $1,210 high is at $1,205.
Around the channel support, the 50 hourly SMA is positioned at $1,204.50. Therefore, if the price dips towards $1,204-1,205, it is likely to find a strong buying interest. Should there be a break below the channel support, the price may drop back towards the $1,200 level.
On the other hand, if the price continues to move higher, it may perhaps break the $1,210 hurdle and rise towards the $1,215 level.
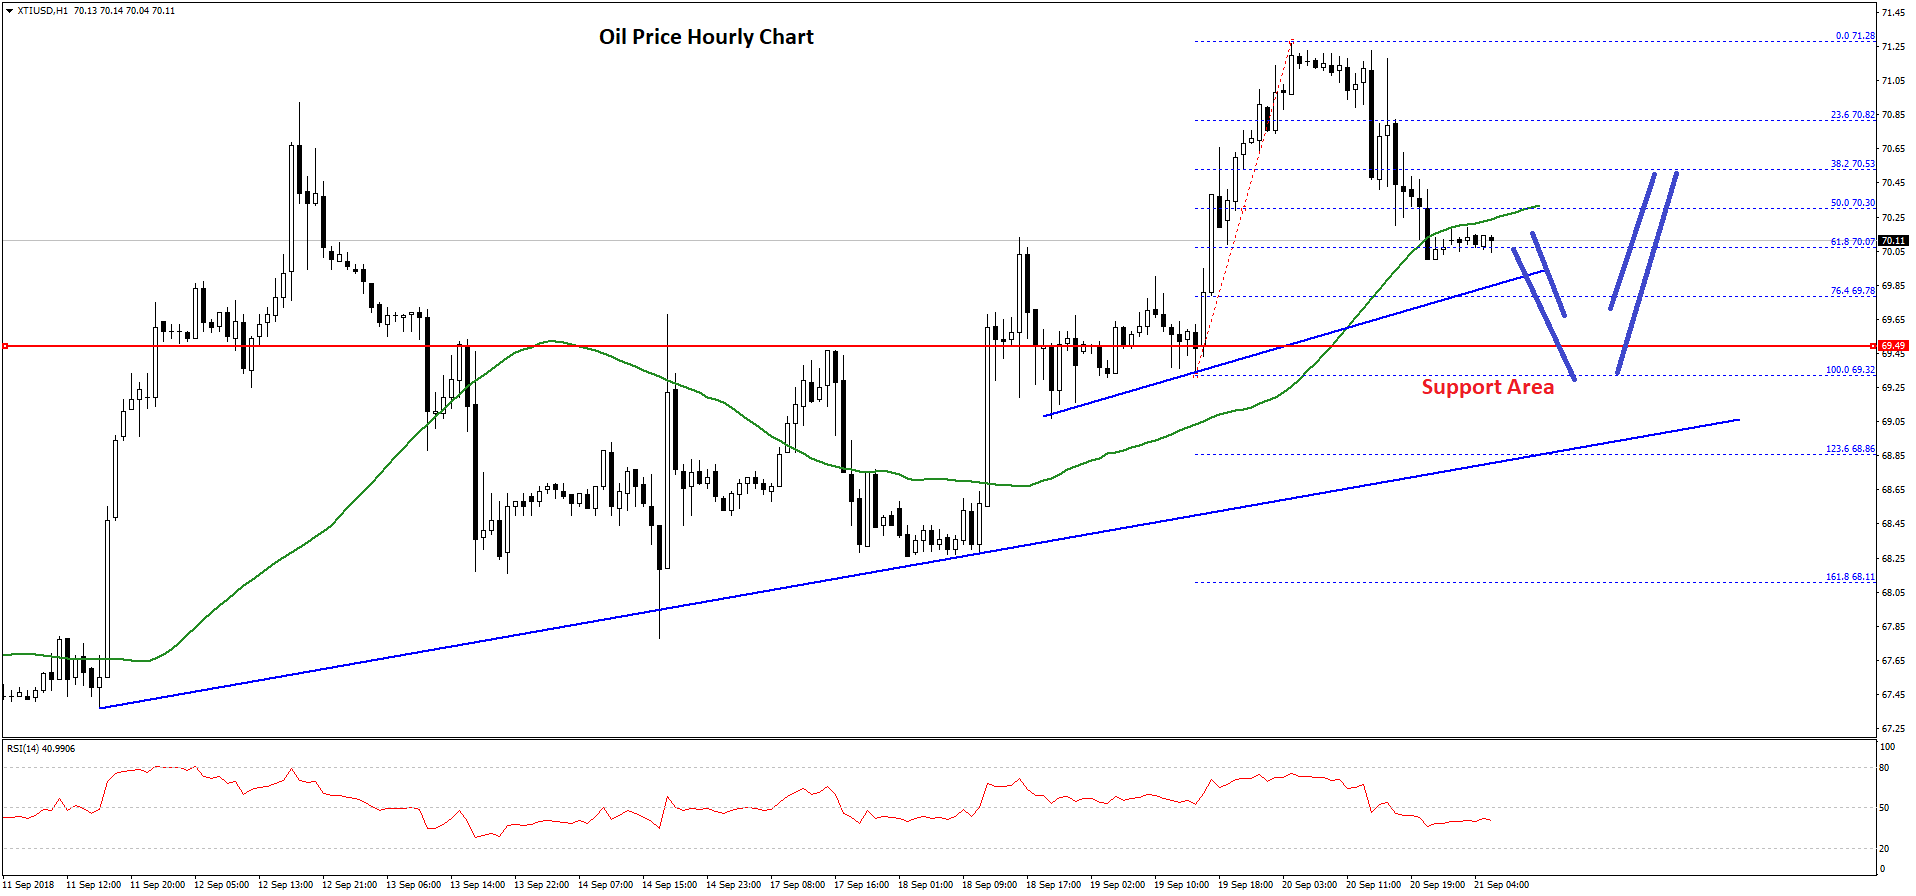
Oil Price Technical Analysis
Crude oil price also made a nice upside move above the $70.00 level recently against the US Dollar. The price even broke the $71.00 level, but buyers failed to hold gains above the $71.20 level.
Later, the price started a downside correction and declined below the $71.00 level. Sellers pushed the price below the 50% Fib retracement level of the last wave from the $69.32 low to $71.28 high.
Moreover, there was a close below the $70.50 support and the 50 hourly simple moving average. However, there are many supports on the downside above the $69.50 level. There are also two bullish trend lines in place with support at $70.00 and $69.20 on the hourly chart of XTI/USD.
The first trend line is close to the 76.4% Fib retracement level of the last wave from the $69.32 low to $71.28 high. Below the first trend line, the price could test the $70.00 support. Finally, the most important support is near the $69.30-50 zone.
Once the current correction phase is complete, the price could rise once again above the $70.50 level. Above this, there is a strong resistance zone near the $71.00 and $71.20 levels where buyers are likely to struggle.