Gold Could Correct Higher While Crude Oil Price Might Decline
Gold price declined recently and broke the key $1,485 support area. Crude oil price is also under pressure and it seems like it could decline below the $56.50 support.
Important Takeaways for Gold and Oil
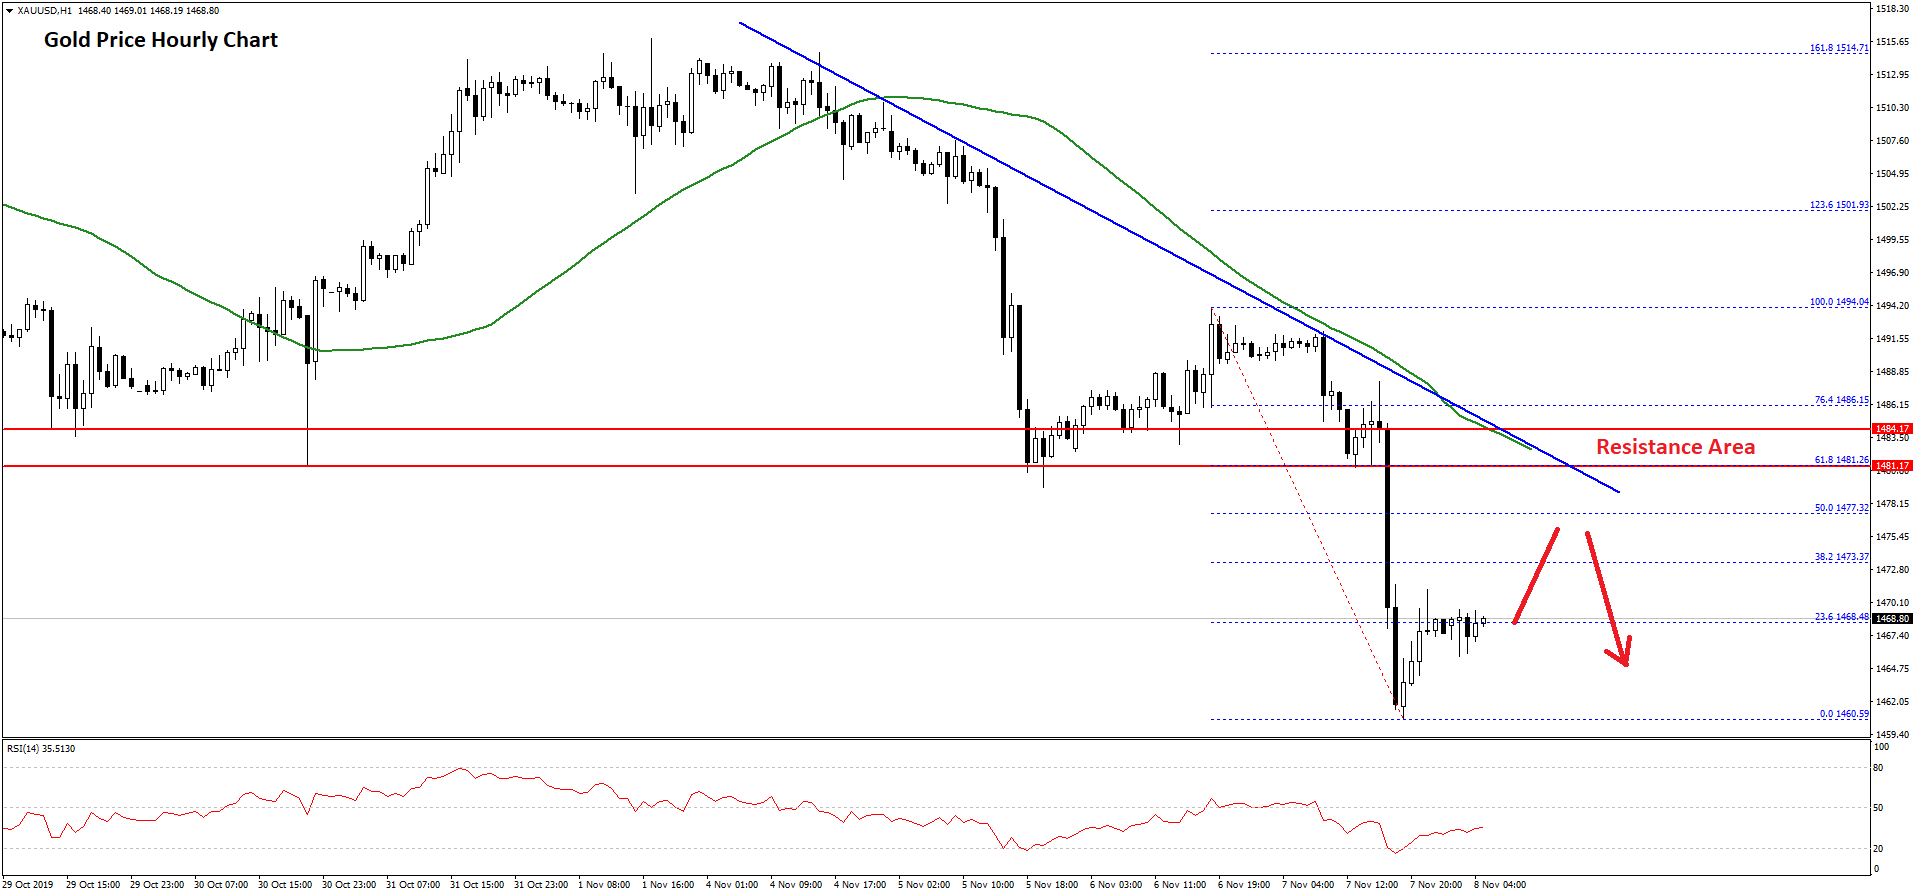
- Gold price declined heavily after it failed to climb above the $1,515 resistance area against the US Dollar.
- There is a major bearish trend line forming with resistance near $1,480 on the hourly chart of gold.
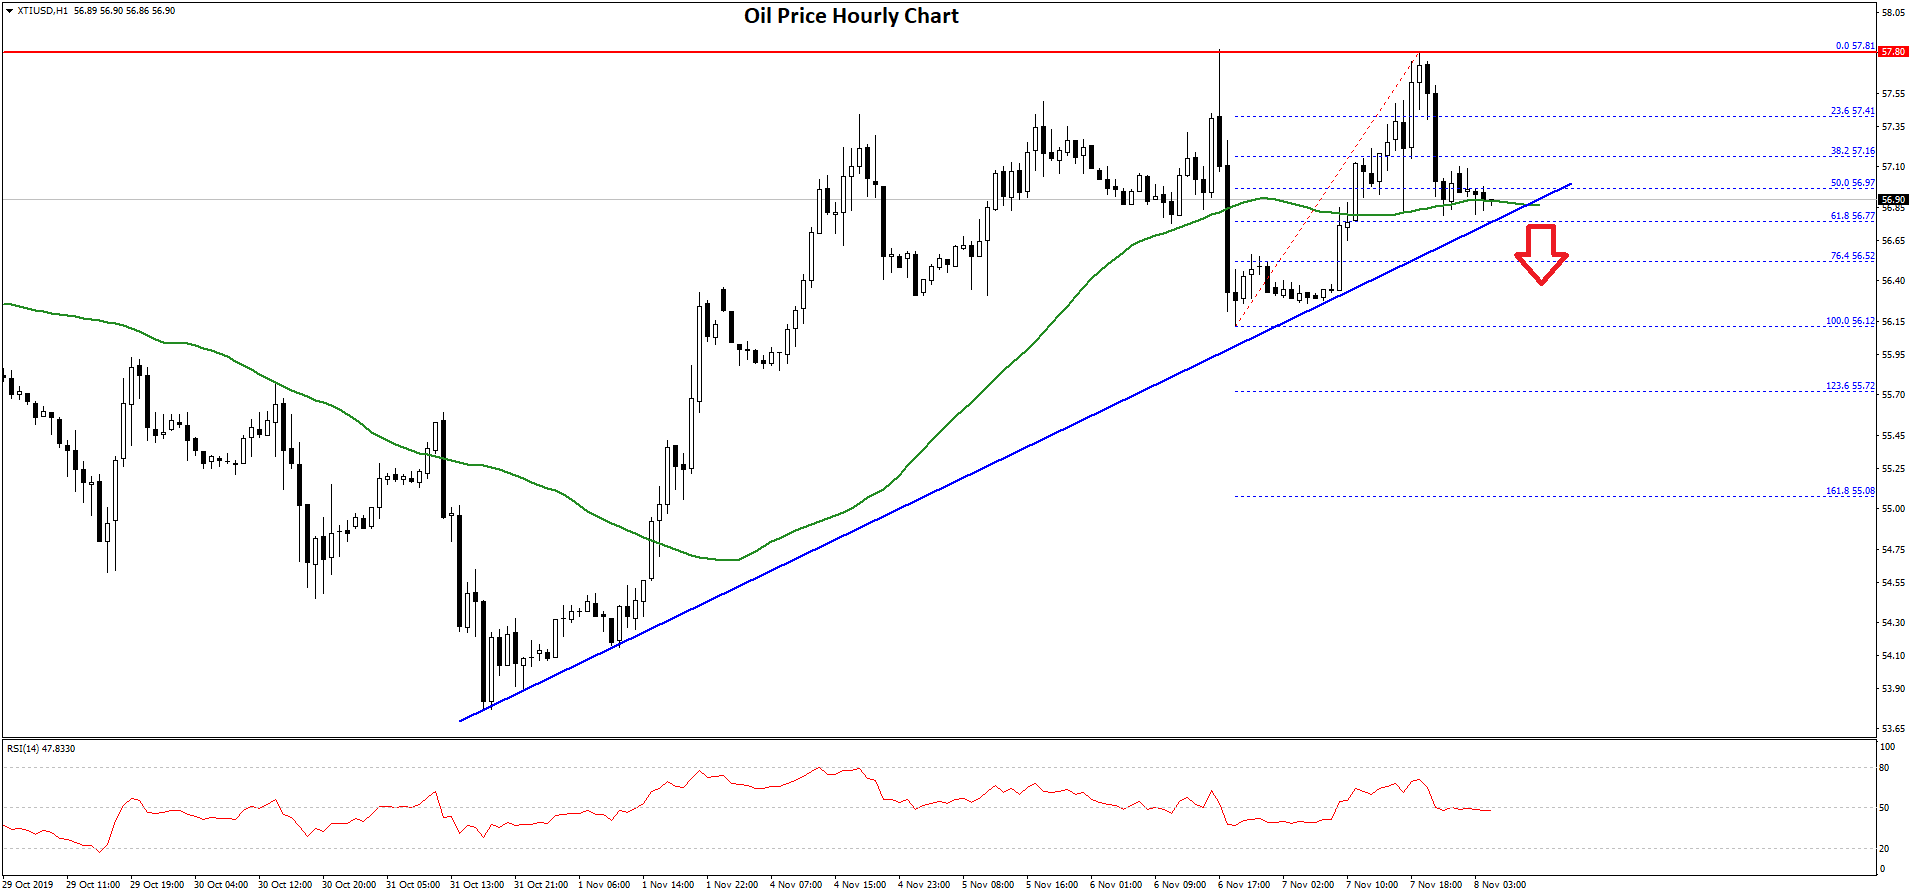
- Crude oil price is struggling to clear $58.00 and it is currently declining below $57.00.
- There is a key bullish trend line forming with support near $56.80 on the hourly chart of XTI/USD.
Gold Price Technical Analysis
Recently, gold price made a few attempts to surpass the $1,515 resistance area against the US Dollar. It failed to continue higher and started a fresh decline below the $1,505 and $1,500 support levels.
During the decline, the price broke a couple of important supports near the $1485 level and the 50 hourly simple moving average. Finally, the price broke the $1,475 support area and traded as low as $1,460 on FXOpen.
At the moment, the price is correcting higher above $1,465. It is trading near the 23.6% Fib retracement level of the recent decline from the $1,494 high to $1,460 low.
However, there are many hurdles on the upside near the $1,475 and $1,480 levels. Besides, the 50% Fib retracement level of the recent decline from the $1,494 high to $1,460 low is near the $1,477 level to act as a resistance.
There is also a major bearish trend line forming with resistance near $1,480 on the hourly chart of gold. The main resistance is near the $1,485 level, above which the price could start a nice upward move.
On the downside, an initial support is near the $1,460 level. If gold price fails to stay above the $1,460 support, there is a risk of more downsides towards the $1,450 support area.
Oil Price Technical Analysis
This week, there was a steady rise in crude oil price above the $55.00 resistance area against the US Dollar. The price even broke the $56.20 resistance zone to move into a positive zone.
Finally, the price settled above $56.50 and the 50 hourly simple moving average. However, the bulls faced a strong resistance near the $57.80 and $58.00 levels. A high was formed near $57.81 and the price started a downside correction.
There was a break below the $57.50 support area. Moreover, the price traded below the 23.6% Fib retracement level of the recent wave from the $56.12 low to $57.81 high.
At the moment, the price is trading near the $57.00 support area and the 50 hourly SMA. Besides, there is a key bullish trend line forming with support near $56.80 on the hourly chart of XTI/USD.
The 61.8% Fib retracement level of the recent wave from the $56.12 low to $57.81 high is also near the $56.75 area. Therefore, if there is a downside break below the $57.00 and $56.80 support, there is a risk of more downsides in the coming days.
On the upside, the $57.50 level is an immediate resistance. However, the main resistance for crude oil price is near the $57.80 and $58.00 levels, above which the price could rally to $60.00.