Gold Could Correct Lower While Oil Price Remains in Uptrend
Gold price failed to stay above $1,210 and declined below $1,205. Crude oil price remains in an uptrend, but it could correct slightly in the short term.
Important Takeaways for Gold and Oil
- Gold price settled below a key support and pivot level at $1,208 against the US Dollar.
- There is a contracting triangle in place with resistance at $1,204 on the hourly chart of gold.
- Crude oil price gained bullish momentum recently and broke the $68.00 and $70.00 resistances.
- There is a bullish trend line formed with support at $69.90 on the hourly chart of XTI/USD.
Gold Price Technical Analysis
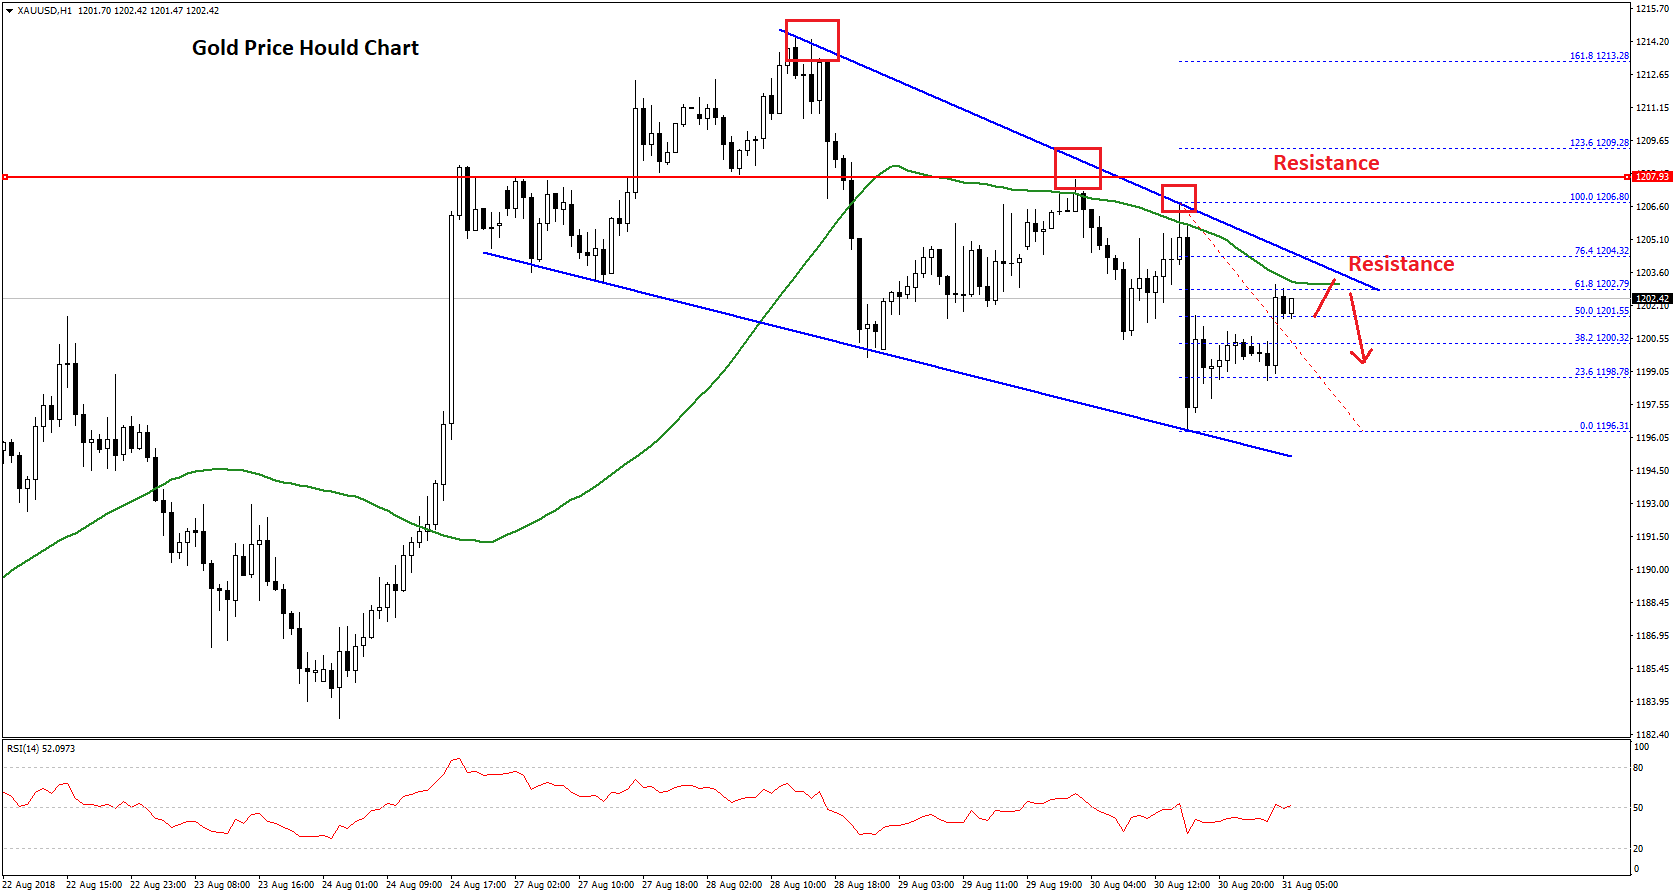
Gold price surged higher after forming a key bottom near $1,184 against the US Dollar. The price climbed above the $1,190, $1,200 and $1,210 resistance levels to move into a bullish zone.
The upside move was strong as the price traded towards the $1,215 level. However, the price failed to hold gains above the $1,210 level and later started a downside move. There was a slow and steady decline and the price broke the $1,210 and $1,208 support levels.
The decline was such that the price even broke the $1,200 support and settled below the 50 hourly simple moving average. It traded as low as $1,196.31 and later corrected higher. It moved above the 50% Fib retracement level of the last decline from the $1,206.80 high to $1,196.31 low.
However, the price is facing resistance near the $1,204 level and the 50 hourly SMA. More importantly, there is a contracting triangle in place with resistance at $1,204 on the hourly chart of gold.
Therefore, the price could fail to break the $1,204-1,205 resistance and decline once again. On the downside, the $1,195 and $1,190 levels may be the next targets for sellers.
On the other hand, if the price breaks the triangle resistance at $1,205 and settles above the 50 hourly SMA, there could be a nice upward move towards the $1,208 pivot level and the $1,210 resistance.
Oil Price Technical Analysis
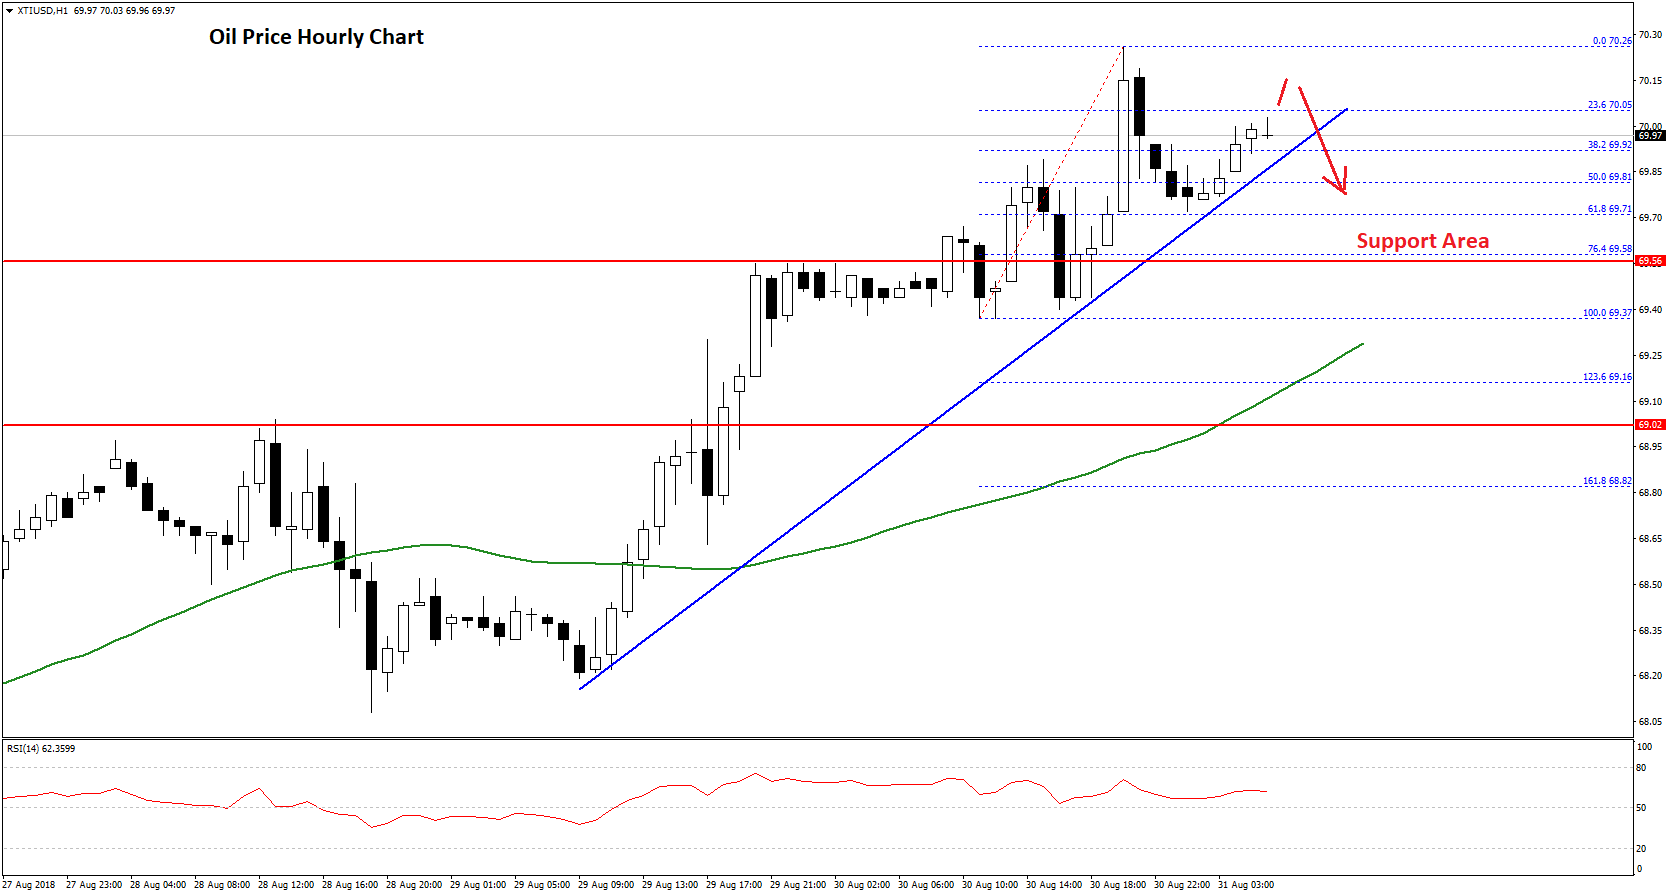
Crude oil price remained in a crucial uptrend from the $65.00 swing low against the US Dollar. The price climbed higher recently and broke many resistances like $66.00, $68.00 and even $70.00.
The price traded towards the $70.25 level and settled above the 50 hourly simple moving average. A high was formed at $70.26 before the price started a downside correction. It moved down and broke the $70.00 support.
There was also a break below the 50% Fib retracement level of the last wave from the $69.37 low to $70.26 high. However, the decline was protected by the $69.75 support.
The 61.8% Fib retracement level of the last wave from the $69.37 low to $70.26 high also acted as a support. Moreover, there is a bullish trend line formed with support at $69.90 on the hourly chart of XTI/USD.
The price recovered and is currently trading near the $70.00 level. At the outset, it seems like the price is struggling to gain momentum above the $70.00 level. Therefore, there is a possibility of a downside correction below the trend line and the $69.75 level in the near term.
Below $69.75, the next major support is positioned near the $69.50 level, which is also a crucial pivot area. On the other hand, if the price continues to move higher, it could break the $70.25 resistance and test the $70.50 level.