Gold Eyeing Further Gains While Oil Turns Bearish
Gold price is placed nicely in a positive zone above the $1,228 support. On the other hand, oil price is under pressure below the $67.50 and $68.50 resistances.
Important Takeaways for Gold and Oil
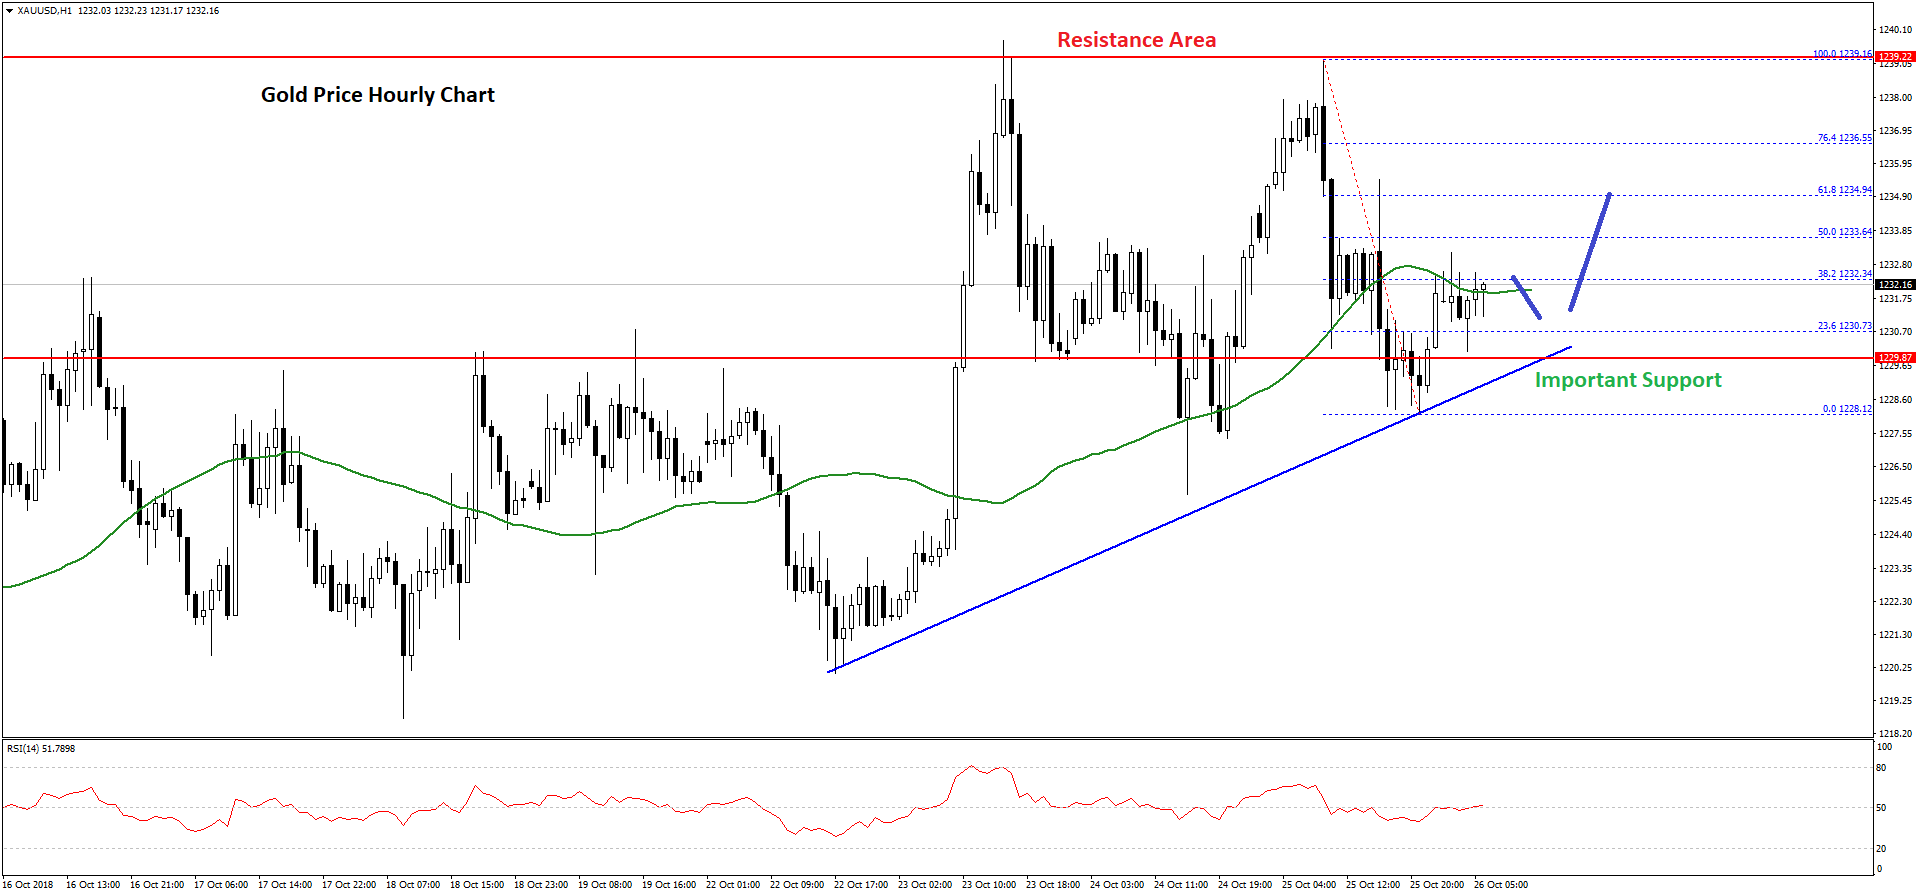
- Gold price failed to break the $1,240 resistance and declined recently against the US Dollar.
- There is a major bullish trend line formed with support at $1,228 on the hourly chart of gold.
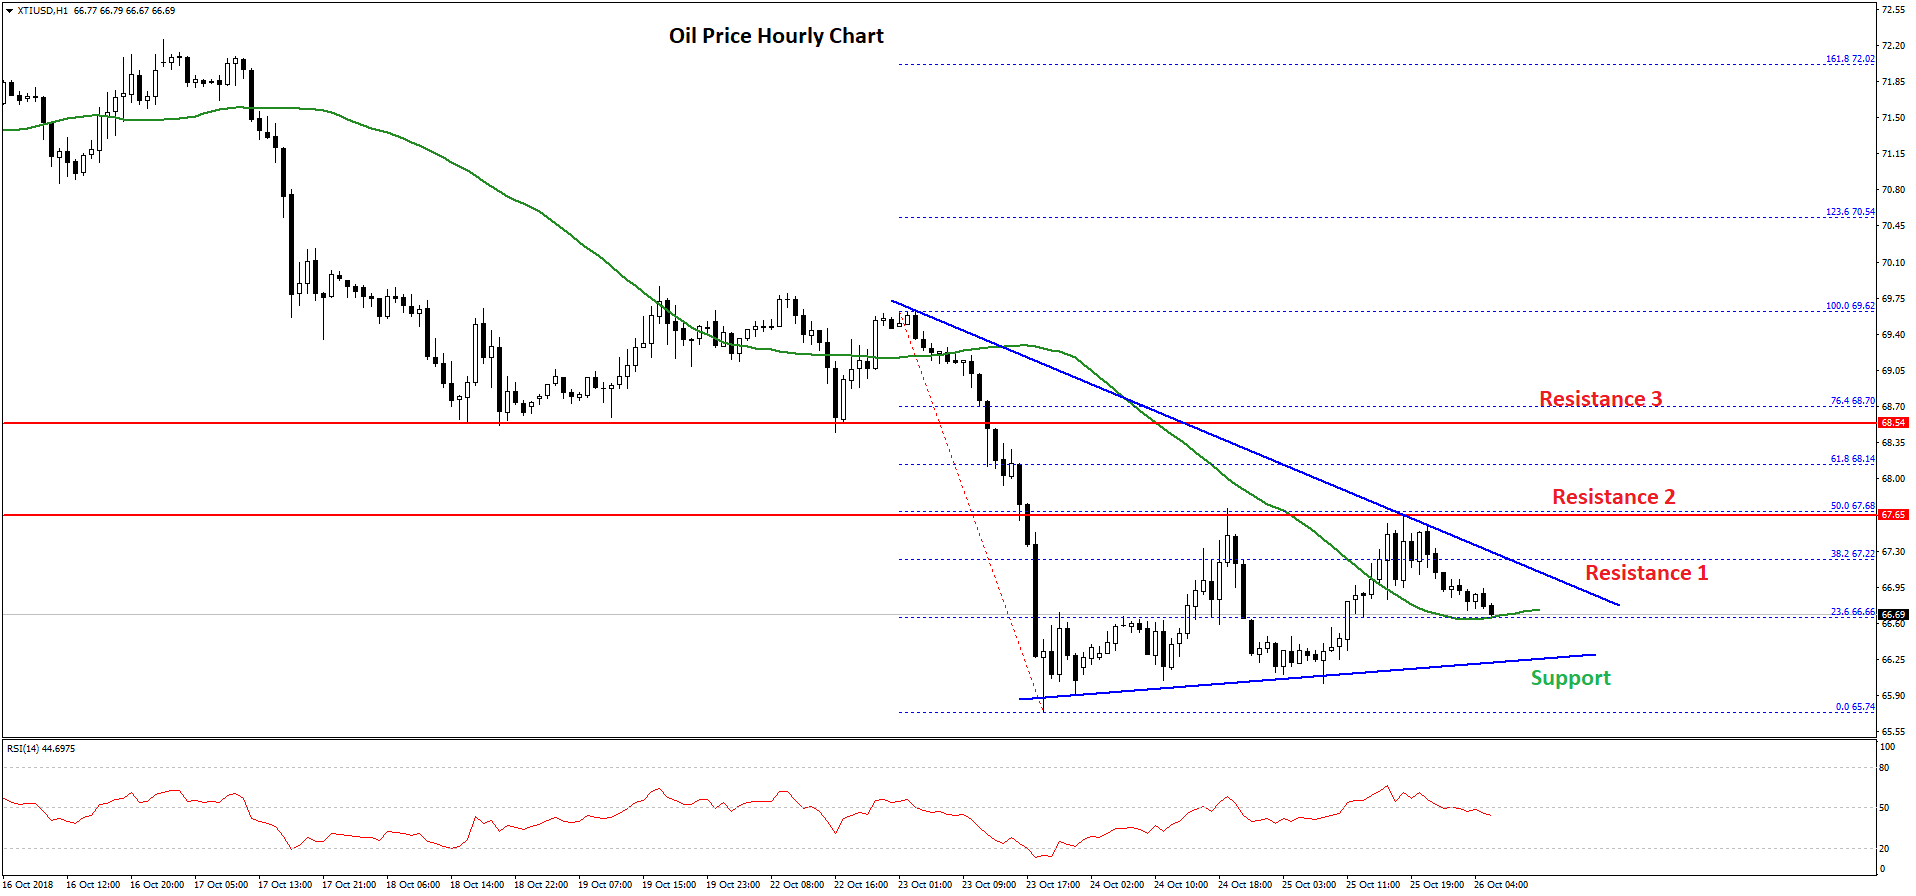
- Crude oil price fell recently and broke the $68.00 and $67.50 support levels.
- There is a new breakout structure forming with resistance near $67.00 on the hourly chart of XTI/USD.
Gold Price Technical Analysis
Gold price gained traction recently and moved up from the $1,221 support area against the US Dollar. The price traded higher and breached the $1,225, $1,230 and $1,236 resistance levels.
During the upside move, the price cleared the $1,238 resistance as well along with the 50 hourly simple moving average. However, buyers failed to clear the $1,240 resistance area. There was a downside reaction and the price declined below the $1,235 support level.
There was also a spike below the $1,230 level and the 50 hourly simple moving average. The price traded as low as $1,228 and later started an upside correction. It moved above the 23.6% Fib retracement level of the last decline from the $1,239 high to $1,228 low.
On the upside, the next resistance is near the $1,233 level, which is the 50% Fib retracement level of the last decline from the $1,239 high to $1,228 low.
A successful close above the $1,233 and $1,235 resistance levels could open the doors for a push towards the $1,240 level in the near term. On the downside, there is a decent support near the $1,229 and $1,228 levels.
Moreover, there is a major bullish trend line formed with support at $1,228 on the hourly chart of gold. If the price fails to stay above the trend line and the $1,228 support, there could be a downside extension towards the $1,222 level.
Oil Price Technical Analysis
Crude oil price started a major downside move from the $72.00 swing high against the US Dollar. The price declined sharply and broke the $71.00, $70.00, $68.50 and $67.00 support levels.
The decline was such that there was a close below the $67.00 level and the 50 hourly simple moving average. The price traded as low as $65.74 and it is currently correcting higher. Buyers pushed the price above the $67.00 level and the 38.2% Fib retracement level of the recent decline from the $69.62 high to $65.74 low.
However, the upside move was protected by the $67.70 level and the 50% Fib retracement level of the recent decline from the $69.62 high to $65.74 low.
At the outset, there is a new breakout structure forming with resistance near $67.00 on the hourly chart of XTI/USD. On the upside, the price must break the $67.00 and $67.50 resistance levels to start a decent recovery in the near term.
On the other hand, if there is a downside break below the $66.30 support, the price may extend the current decline towards the $65.74 low. Any further declines could put a lot of pressure on buyers and the price may decline towards the $65.00 and $64.00 supports.