Gold Price And Crude Oil Price Could Continue Higher
Gold price is trading with a bullish bias above the $1,472 support area. Crude oil price is trading in a strong uptrend and it could continue to rise above the $61.50 resistance.
Important Takeaways for Gold and Oil
- Gold price settled above the $1,470 and $1,472 support levels against the US Dollar.
- There is a major bullish trend line forming with support near $1,475 on the hourly chart of gold.
- Crude oil price is following a significant uptrend above the $60.00 support area.
- There is a crucial bullish trend line forming with support near $60.90 on the hourly chart of XTI/USD.
Gold Price Technical Analysis
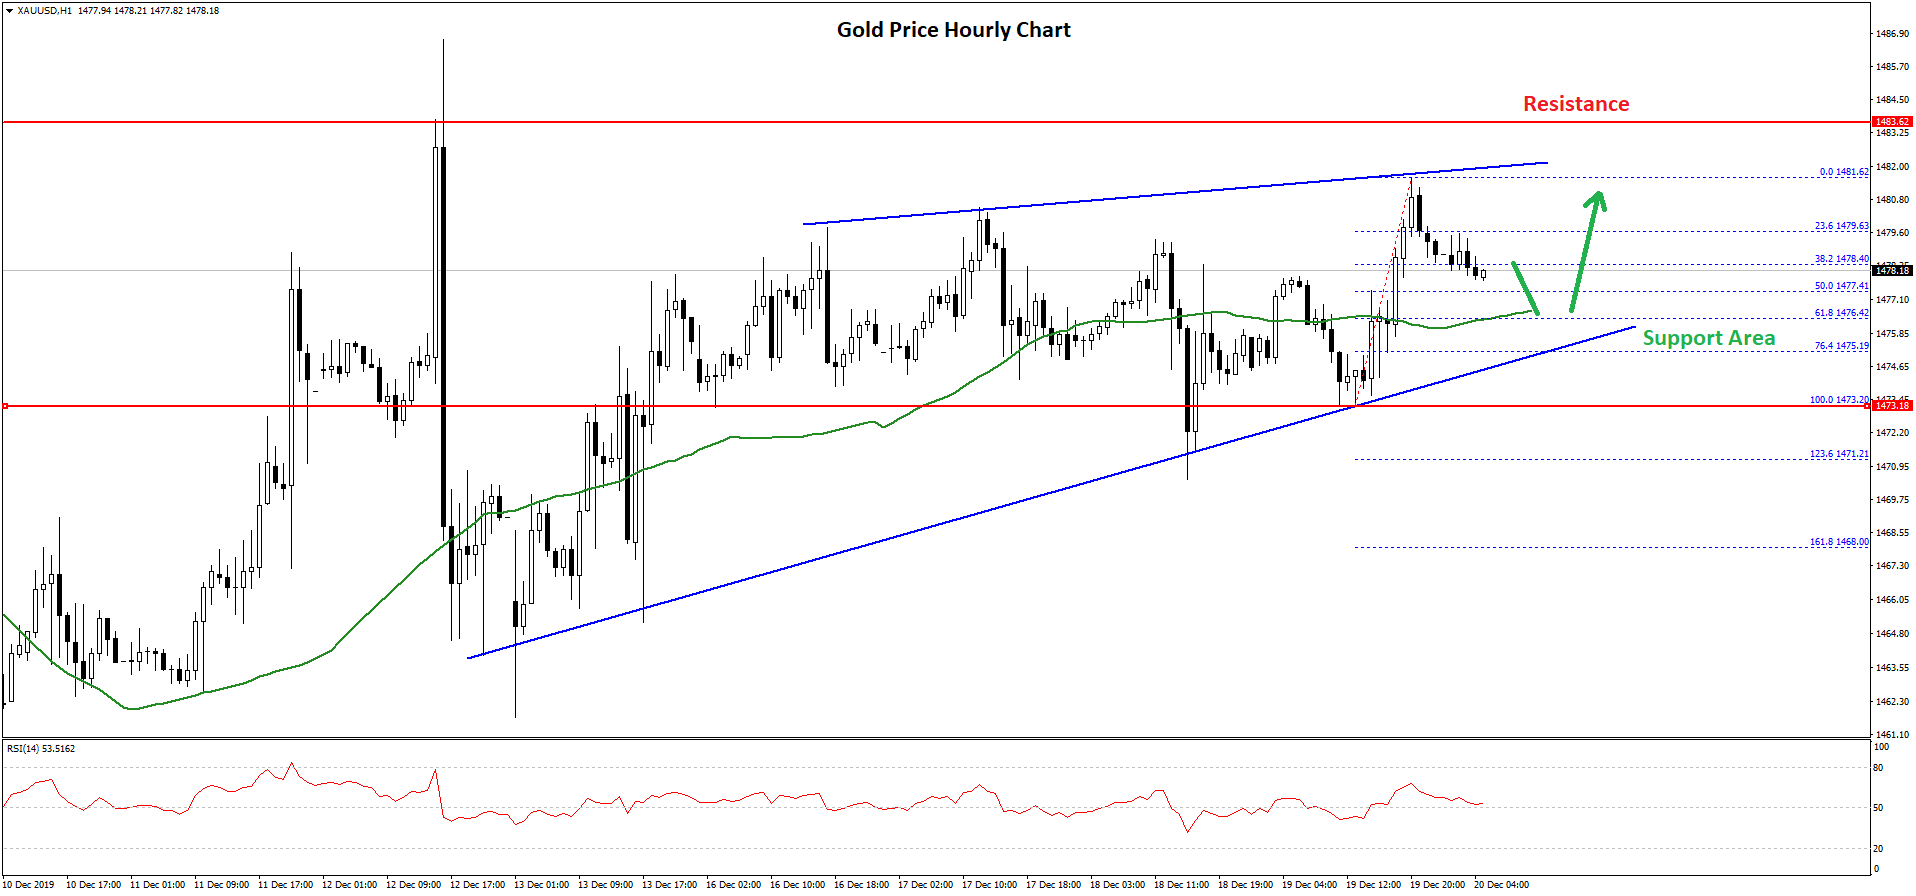
In the past few days, gold price remained in a positive zone above the $1,460 support area against the US Dollar. As a result, there was a slow and steady rise above the $1,470 and $1,475 resistance levels.
There was also a close above the $1,472 level and the 50 hourly simple moving average. However, the price struggled to gain momentum above $1,480 and the recent high was near $1,481 on FXOpen.
The price is currently correcting lower below $1,480, plus the 23.6% Fib retracement level of the upward move from the $1,473 low to $1,481 high.
An immediate support is near the $1,477 level. Besides, the 50% Fib retracement level of the upward move from the $1,473 low to $1,481 high is near $1,477.
The main support is near the $1,475 level. There is also a major bullish trend line forming with support near $1,475 on the hourly chart of gold. Therefore, a downside break below $1,475 could push the price towards the $1,470 support area.
On the upside, the main hurdles are seen near the $1,480 and $1,482 levels. If there is an upside break above the $1,482 resistance, the price could climb towards the $1,490 area. Any further gains could lead gold price towards the $1,500 resistance area in the near term.
Oil Price Technical Analysis
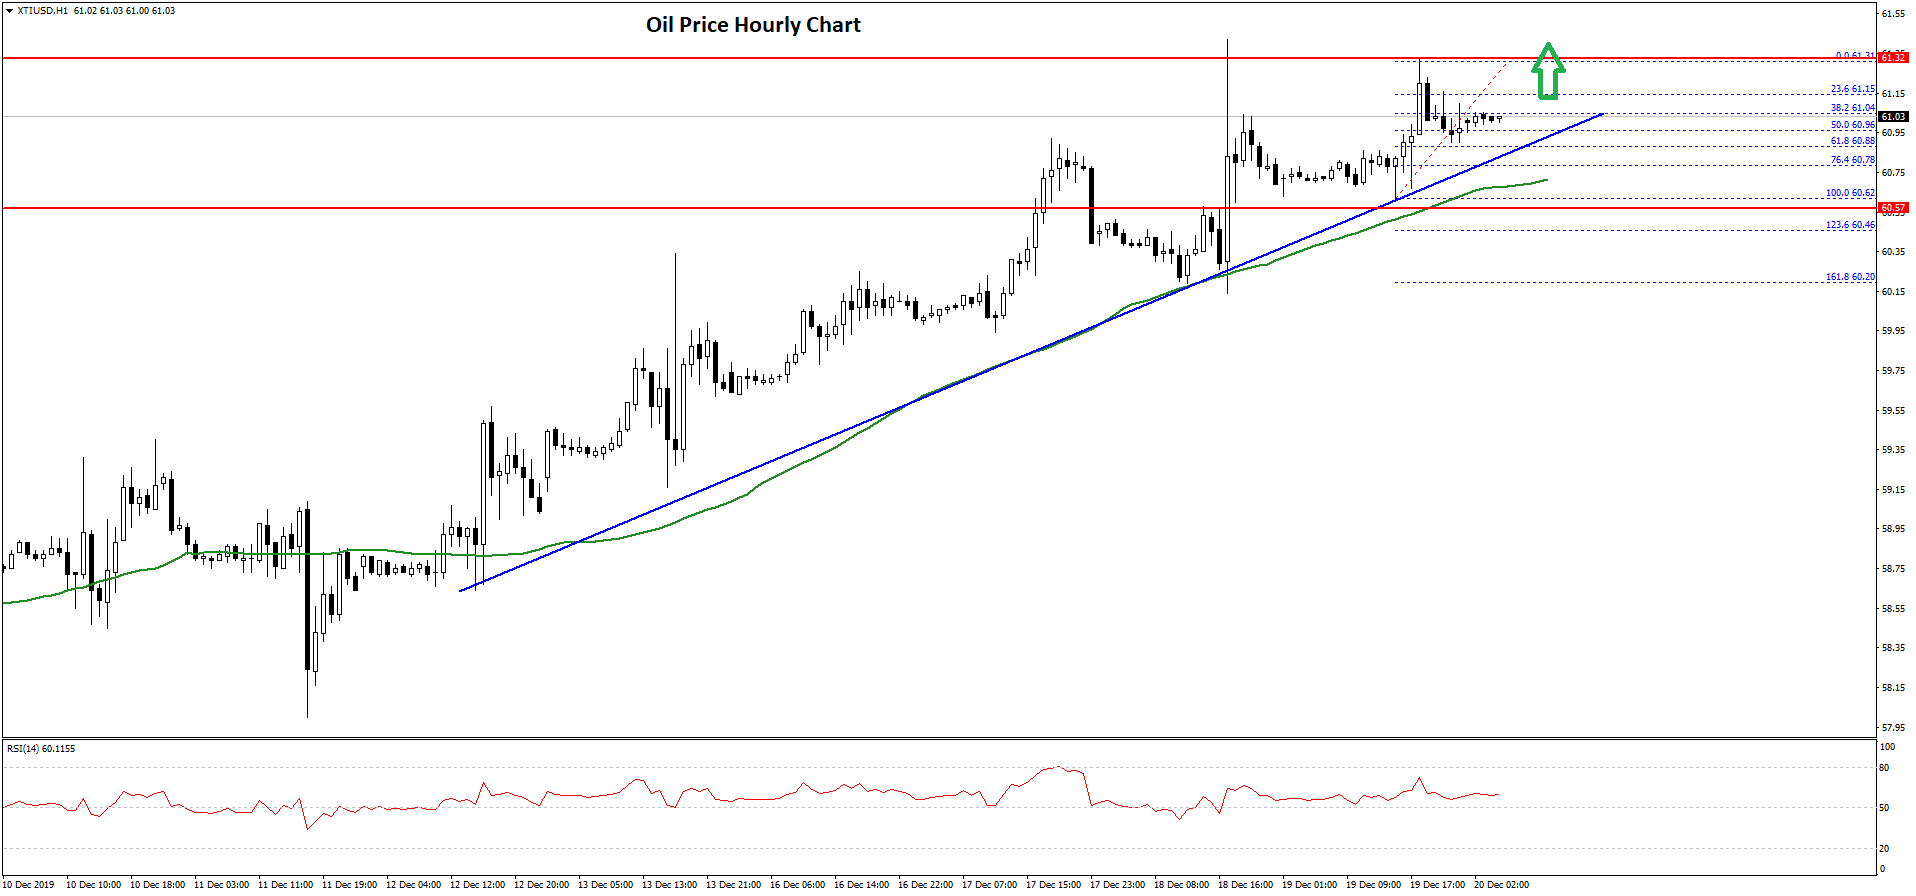
In the past few days, there was a strong uptrend established in crude oil price above the $58.50 support area against the US Dollar. The price traded above the $59.50 and $60.00 resistance levels.
Moreover, there was a close above the $60.00 level and the 50 hourly simple moving average. It opened the doors for more gains above $61.00 and $61.20. The recent high was near $61.31 and the price is currently correcting lower.
It broke the 50% Fib retracement level of the recent wave from the $60.62 low to $61.31 high. On the downside, there are many supports near $60.95 $60.60.
More importantly, there is a crucial bullish trend line forming with support near $60.90 on the hourly chart of XTI/USD. If there is a break below the trend line, the price could test the $60.75 support or the 50 hourly simple moving average.
The main support zone is near the $60.50 level, below which crude oil price is likely to accelerate lower below the $60.20 and $60.00 levels in the coming sessions.
Conversely, crude oil price could continue to rise above $61.20 and $61.30. The main hurdle is near the $61.50 level, above which the bulls are likely to aim a test of the $62.00 resistance area.