Gold Price And Crude Oil Price Could Extend Declines
Gold price climbed higher once again, but it failed to surpass the $1,437 resistance area. Crude oil price is currently correcting higher, but it is facing a lot of hurdles on the upside.
Important Takeaways for Gold and Oil
- Gold price started a downside correction after topping near the $1,437 level against the US Dollar.
- There is a major bullish trend line forming with support near $1,415 on the hourly chart of gold.
- Crude oil price started a decent recovery after it tested the key $56.00 support area.
- There is a key bearish trend line forming with resistance near $56.80 on the hourly chart of XTI/USD.
Gold Price Technical Analysis
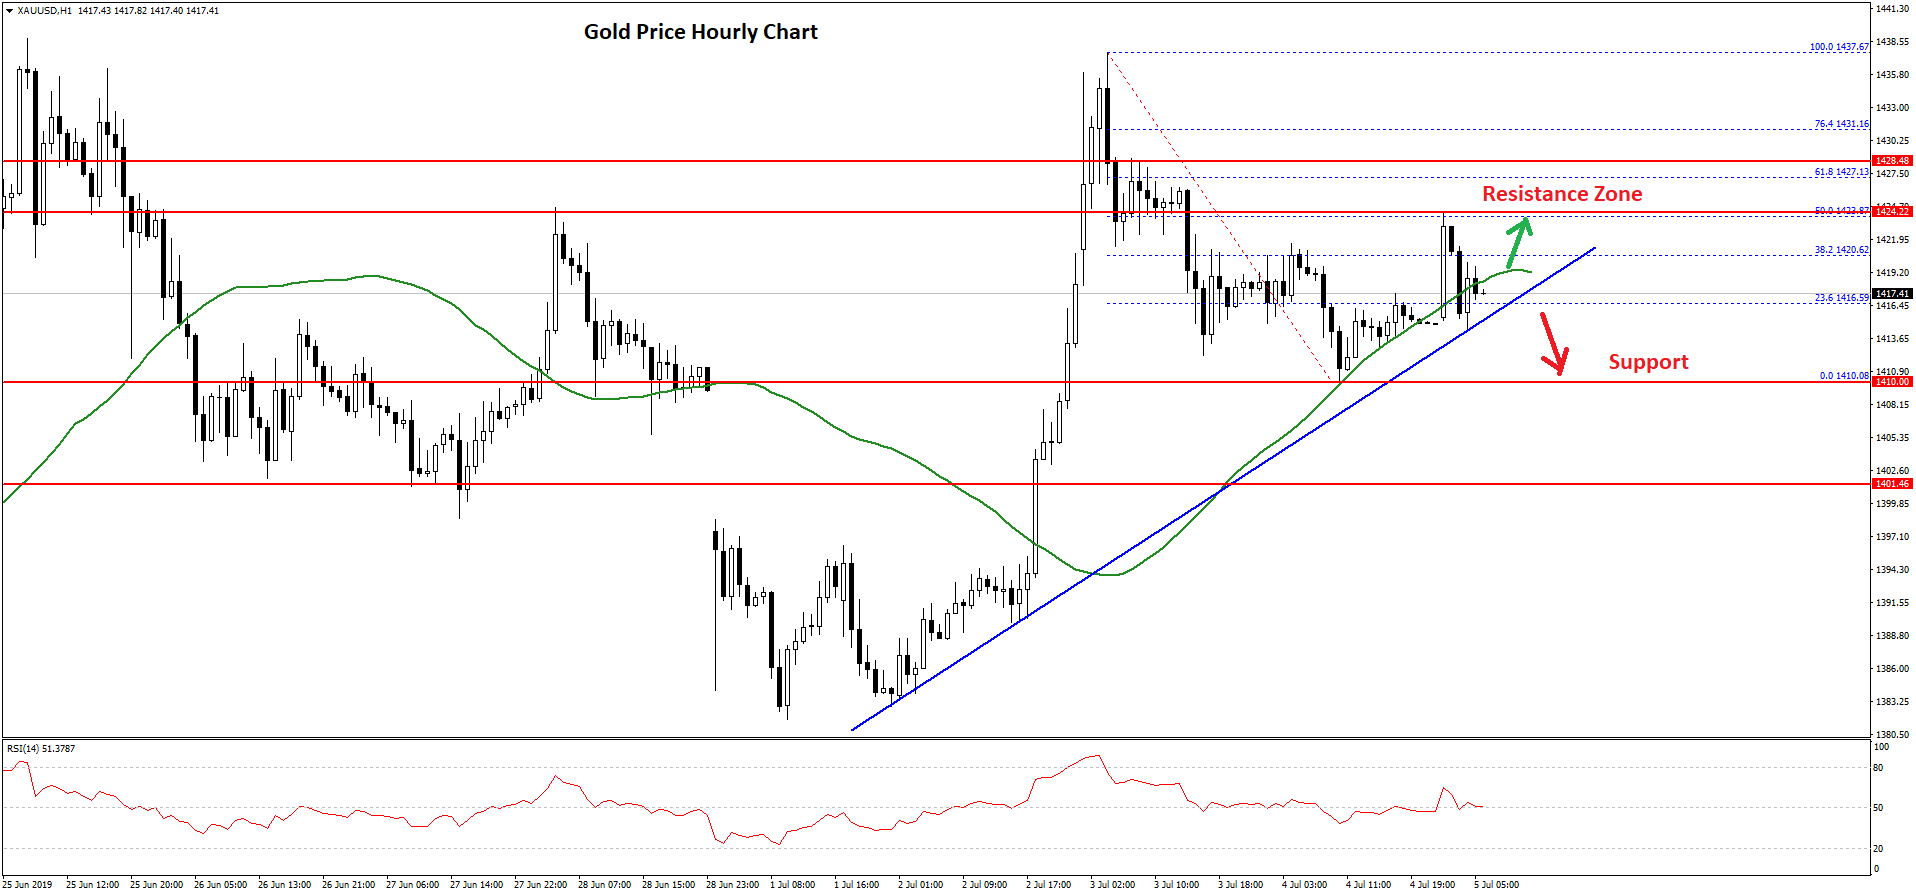
Gold price gained traction this week and climbed above the $1,410 and $1,420 resistance levels against the US Dollar. The price even broke the $1,430 resistance level, but it struggled to climb further higher.
A swing high was formed near $1,437 on FXOpen and the price recently started a downside correction. It broke the $1,425 and $1,420 support levels. It tested the $1,410 level and it is currently recovering higher.
There was a break above the 23.6% Fib retracement level of the recent decline from the $1,437 high to $1,410 low. The price remained above the $1,415 level and the 50 hourly simple moving average.
However, the price struggled to clear the $1,425 resistance plus the 50% Fib retracement level of the recent decline from the $1,437 high to $1,410 low.
At the moment, the price is trading just above the $1,415 support area. There is also a major bullish trend line forming with support near $1,415 on the hourly chart of gold. If there is a downside break below the trend line and the 50 hourly simple moving average, the price could revisit the $1,410 support area.
On the upside, there is a strong resistance near the $1,422 and $1,425 levels. If there is a break above the $1,425 resistance, the price could accelerate above the $1,430 level in the near term.
Oil Price Technical Analysis
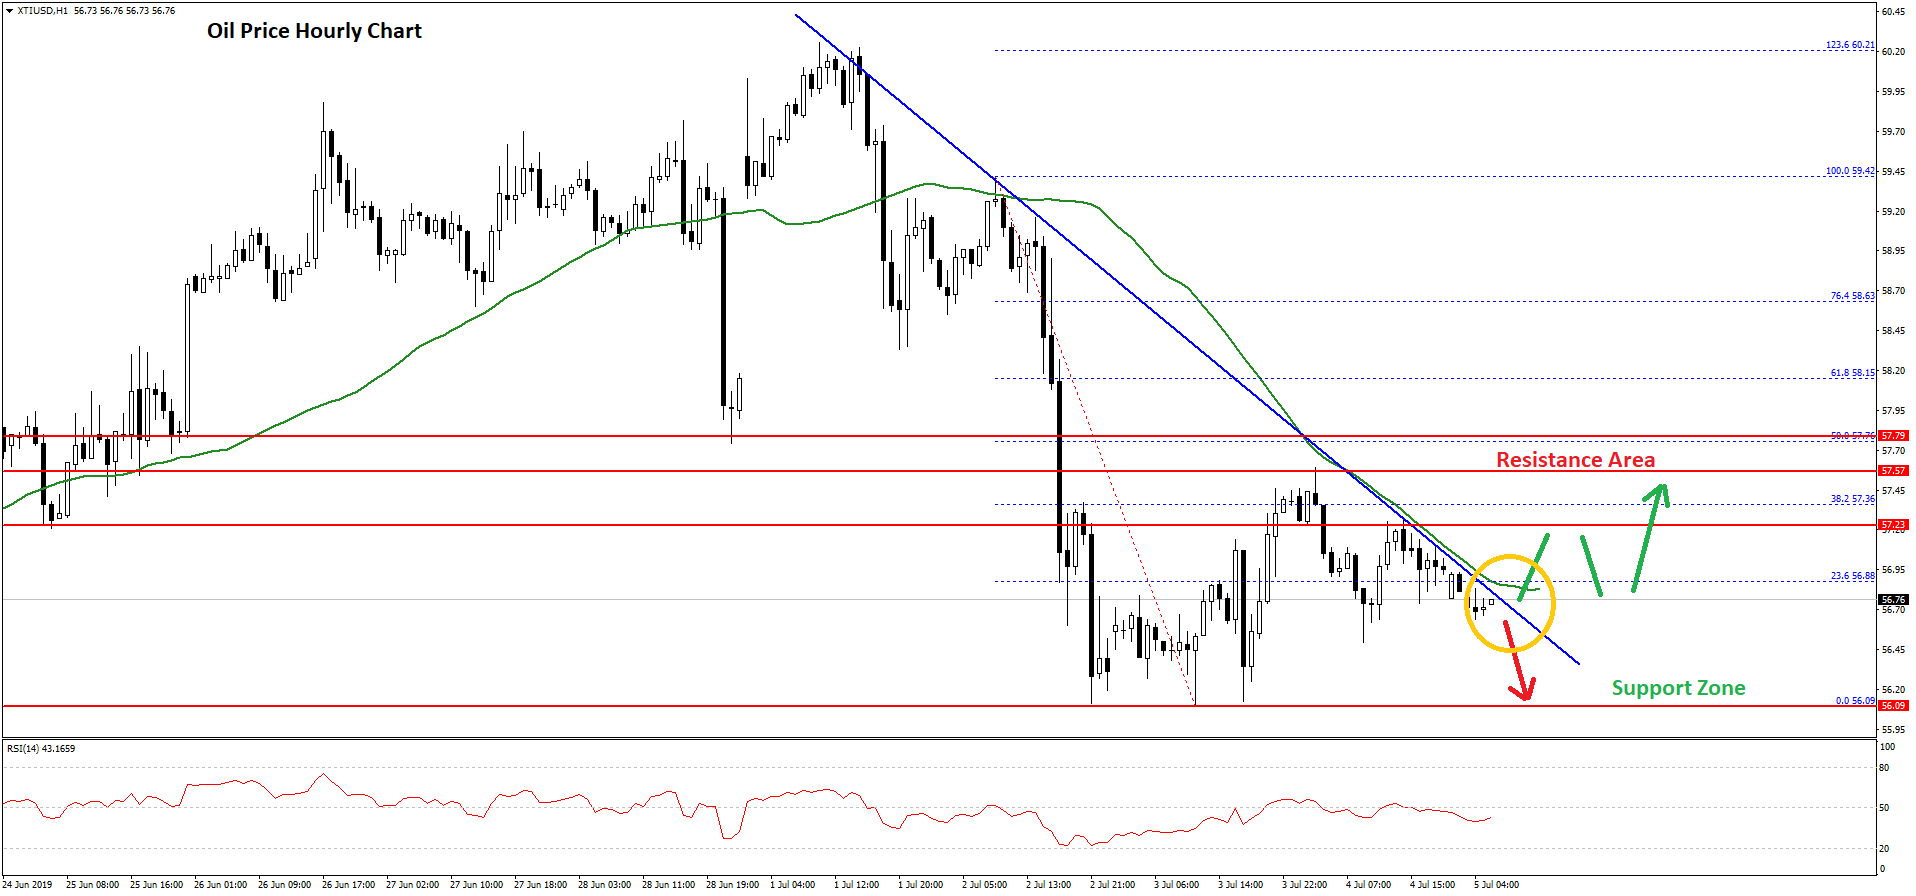
After topping near the $60.20 level, crude oil price started a strong decline against the US Dollar. The price broke the $59.50 and $58.00 support levels to move into a bearish zone.
The decline was such that the price settled below the $57.50 support and 50 hourly simple moving average. It traded close to the $56.00 support area and a swing low was formed near the $56.09.
Recently, it corrected higher above the $56.50 resistance and the 23.6% Fib retracement level of the recent decline from the $59.42 high to $56.09 low. However, the upside move was capped by the $57.50 resistance.
Moreover, the price failed to test the 50% Fib retracement level of the recent decline from the $59.42 high to $56.09 low. There is also a key bearish trend line forming with resistance near $56.80 on the hourly chart of XTI/USD.
If there is an upside break above the trend line and the 50 hourly SMA, the price could recover towards the $57.50 or $58.00 resistance.
On the downside, the main supports are near $56.40 and $56.10, below which crude oil price might decline sharply below $56.00. The next major support is near the $55.00 level.