Gold Price And Crude Oil Price Could Extend Losses
Gold price struggled to continue higher above $1,745 and it is currently declining. Similarly, crude oil price is facing an increase in selling pressure below the $36.50 support.
Important Takeaways for Gold and Oil
- Gold price is showing a lot of bearish signs and it is trading below $1,730 against the US Dollar.
- There was a break below a key bullish trend line with support near $1,726 on the hourly chart of gold.
- Crude oil price declined sharply after forming a major top near the $40.00 level.
- There was a break below an important bullish trend line with support near $37.85 on the hourly chart of XTI/USD.
Gold Price Technical Analysis
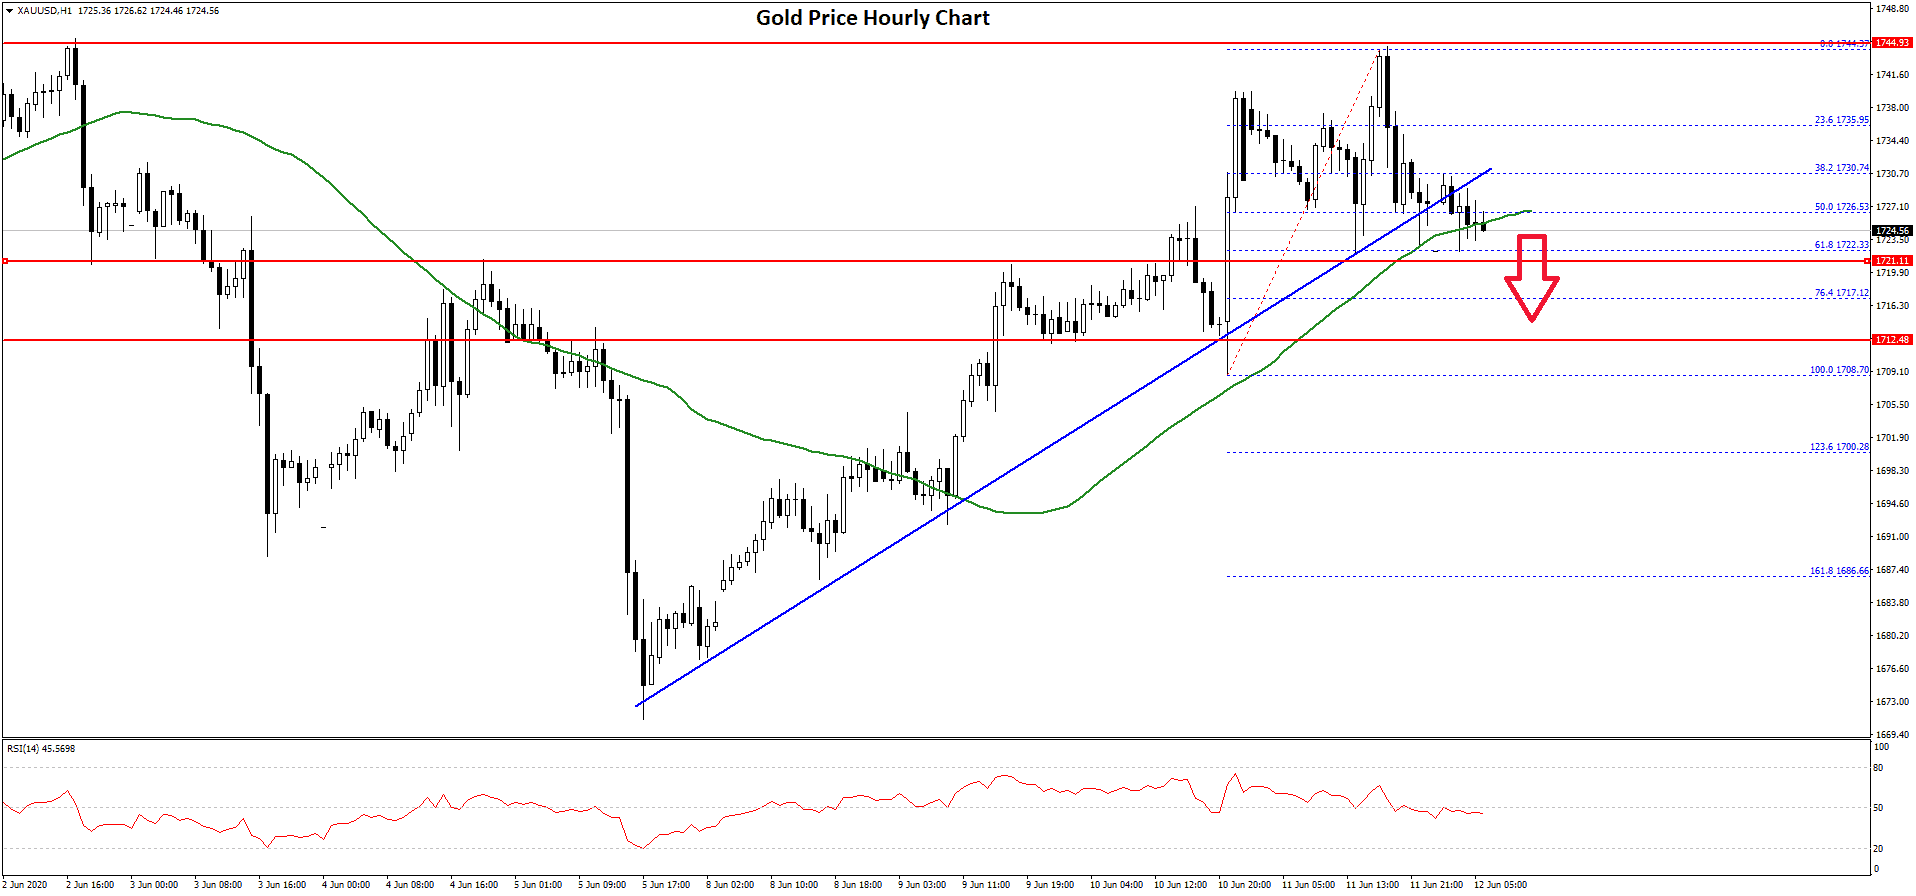
Gold price struggled to gain strength above the $1,745 level and started a fresh decline against the US Dollar. The price traded as high as $1,744 on FXOpen and recently declined below the $1,735 support level.
There was a break below the $1,730 support and the 50 hourly simple moving average. Besides, the price traded below the 50% Fib retracement level of the upward move from the $1,708 low to $1,744 high.
More importantly, there was a break below a key bullish trend line with support near $1,726 on the hourly chart of gold. The price is now testing the $1,724 and $1,722 support levels.
The 61.8% Fib retracement level of the upward move from the $1,708 low to $1,744 high is also acting as a decent support. If there is a downside break below the $1,722 and $1,720 levels, there are chances of more losses.
The next key support is near the $1,708 low, below which the price might continue to move down towards the $1,700 support zone.
On the upside, an initial resistance is near the $1,730 level. A successful break above the $1,730 and $1,735 levels is needed for a fresh increase towards $1,745 or even $1,750.
Oil Price Technical Analysis
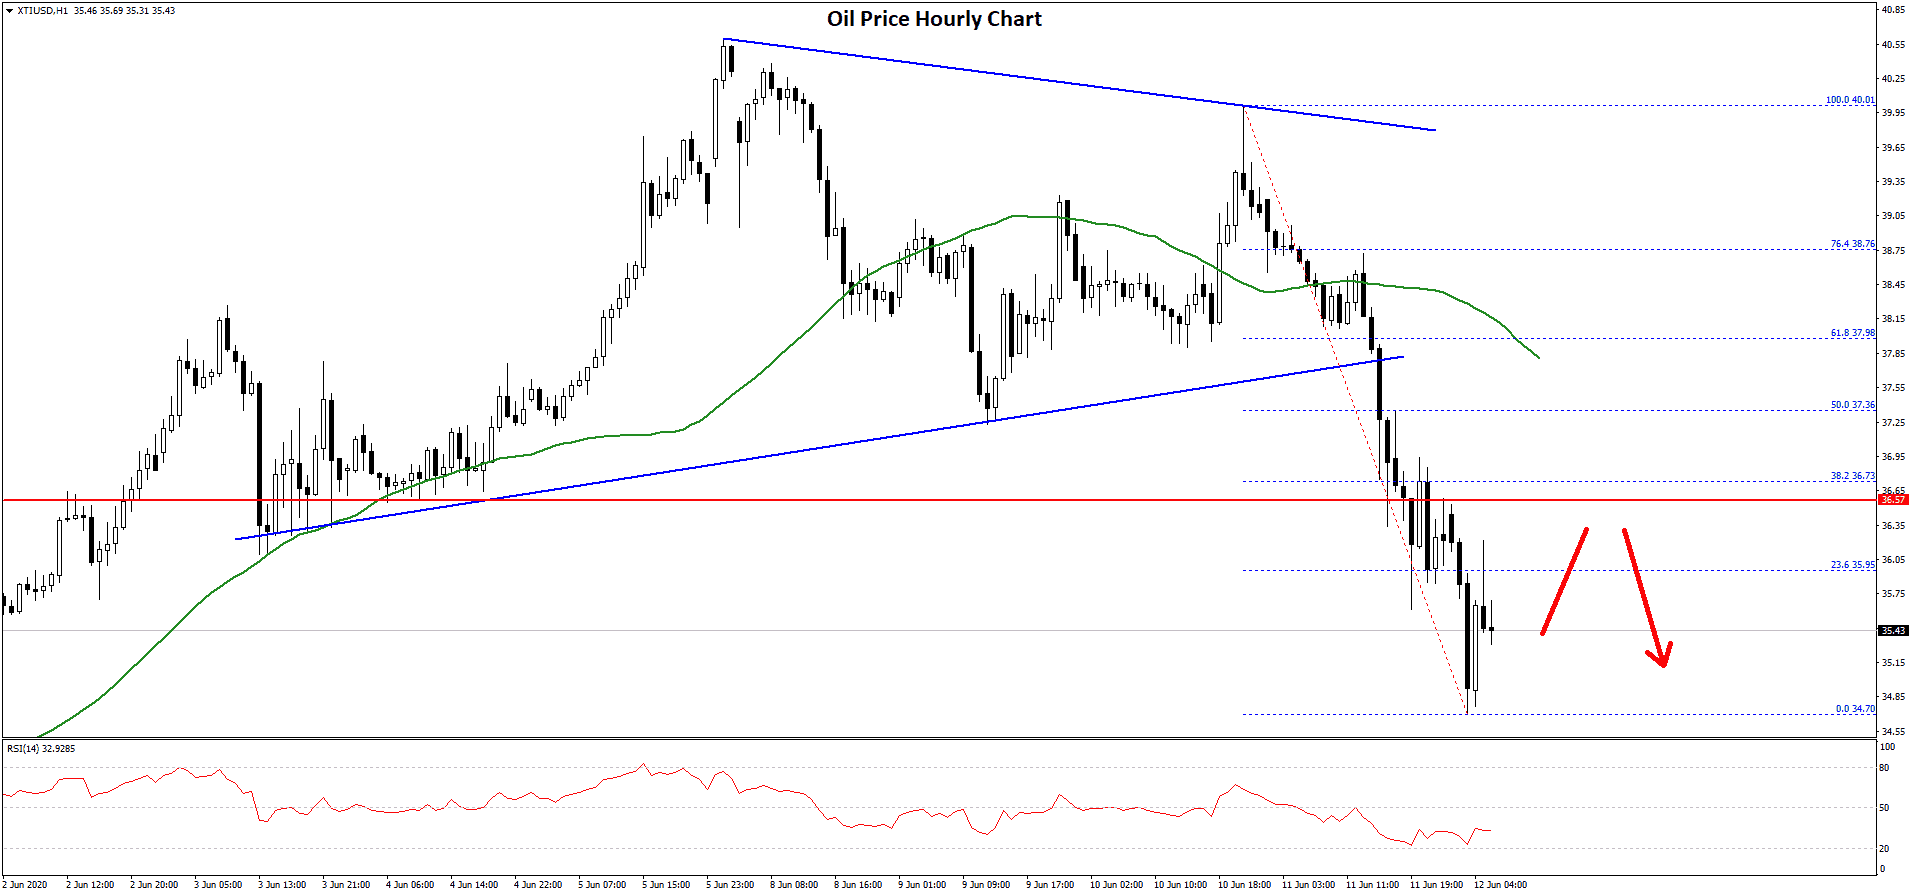
Crude oil price started a major decline from well above the $40.00 level against the US Dollar. The price broke many key supports near $38.00 and $37.50 to move into a bearish zone.
The decline was such that the price settled below the $37.50 level and the 50 hourly simple moving average. Moreover, there was a break below an important bullish trend line with support near $37.85 on the hourly chart of XTI/USD.
The price even broke the $35.50 support and spiked below the $35.00 level. A low is formed near the $34.70 level and the price is currently correcting higher.
It is testing the 23.6% Fib retracement level of the recent decline from the $40.01 high to $34.70 low. On the upside, there is a major resistance forming near the $36.50 and $36.75 levels.
The next major hurdle is near the $37.40 level or the 50% Fib retracement level of the recent decline from the $40.01 high to $34.70 low. To move into a positive zone, the price must break the $37.40 resistance and settle above the 50 hourly simple moving average.
Conversely, the price might continue to move down below the $35.50 and $35.00 support. The next key support is seen near the $34.20 level, below which there is a risk of a larger decline.