


Gold Price and Crude Oil Price Eye Additional Gains
FXOpen

Gold price started a fresh increase above the $1,820 resistance. Crude oil price is also rising and it is showing positive signs above $70.00.
Important Takeaways for Gold and Oil
- Gold price started a fresh upward move after forming a base above $1,780 against the US Dollar.
- There was a break above a key bearish trend line with resistance near $1,805 on the hourly chart of gold.
- Crude oil price also gained pace and it broke the key $70.00 resistance zone.
- There is a major bullish trend line forming with support near $72.30 on the hourly chart of XTI/USD.
Gold Price Technical Analysis
This week, gold price formed a decent support base above the $1,792 zone against the US Dollar. The price started a fresh upward move and it surpassed the $1,800 resistance zone.
The price even settled above the $1,820 level and the 50 hourly simple moving average. Besides, there was a break above a key bearish trend line with resistance near $1,805 on the hourly chart of gold.
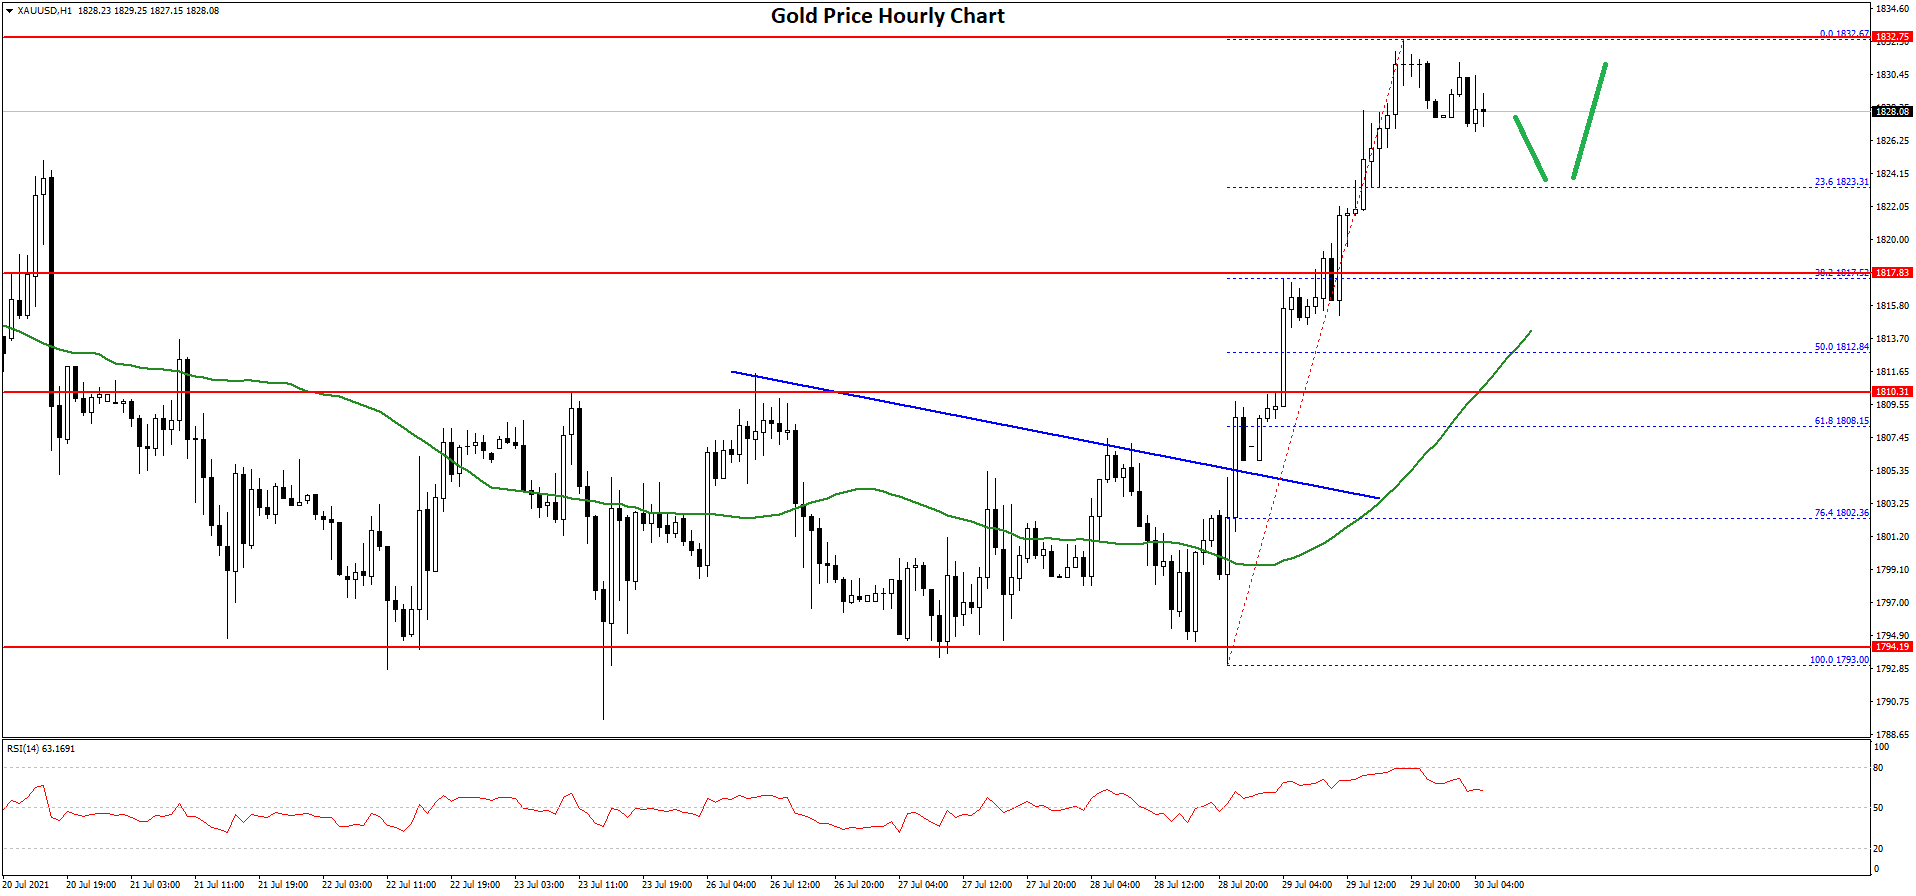
Finally, the price spiked above the $1,830 resistance and it traded as high as $1,832 on FXOpen. The price is now consolidating gains near $1,828. An initial support on the downside is near the $1,823 level. It is near the 23.6% Fib retracement level of the upward move from the $1,793 low to $1,832 high.
The first major support is near the $1,818 level. The main support is now forming near the $1,810 level and the 50 hourly SMA. The 50% Fib retracement level of the upward move from the $1,793 low to $1,832 high is also near $1,812.
If there is a downside break, the price could test the $1,790 support. An immediate resistance on the upside is near the $1,832 level. The first major resistance is near the $1,840 level. If the price breaks the $1,840 level, it could accelerate higher. In the stated case, the price could rise towards the $1,850 zone.
Oil Price Technical Analysis
After a major decline, crude oil price found support near the $65.50 zone against the US Dollar. The price formed a base and it started a fresh increase above the $68.00 resistance.
The bulls remained in control, and the price climbed back above the $70.00 level. There was also a break above the $72.00 resistance zone and the 50 hourly simple moving average.
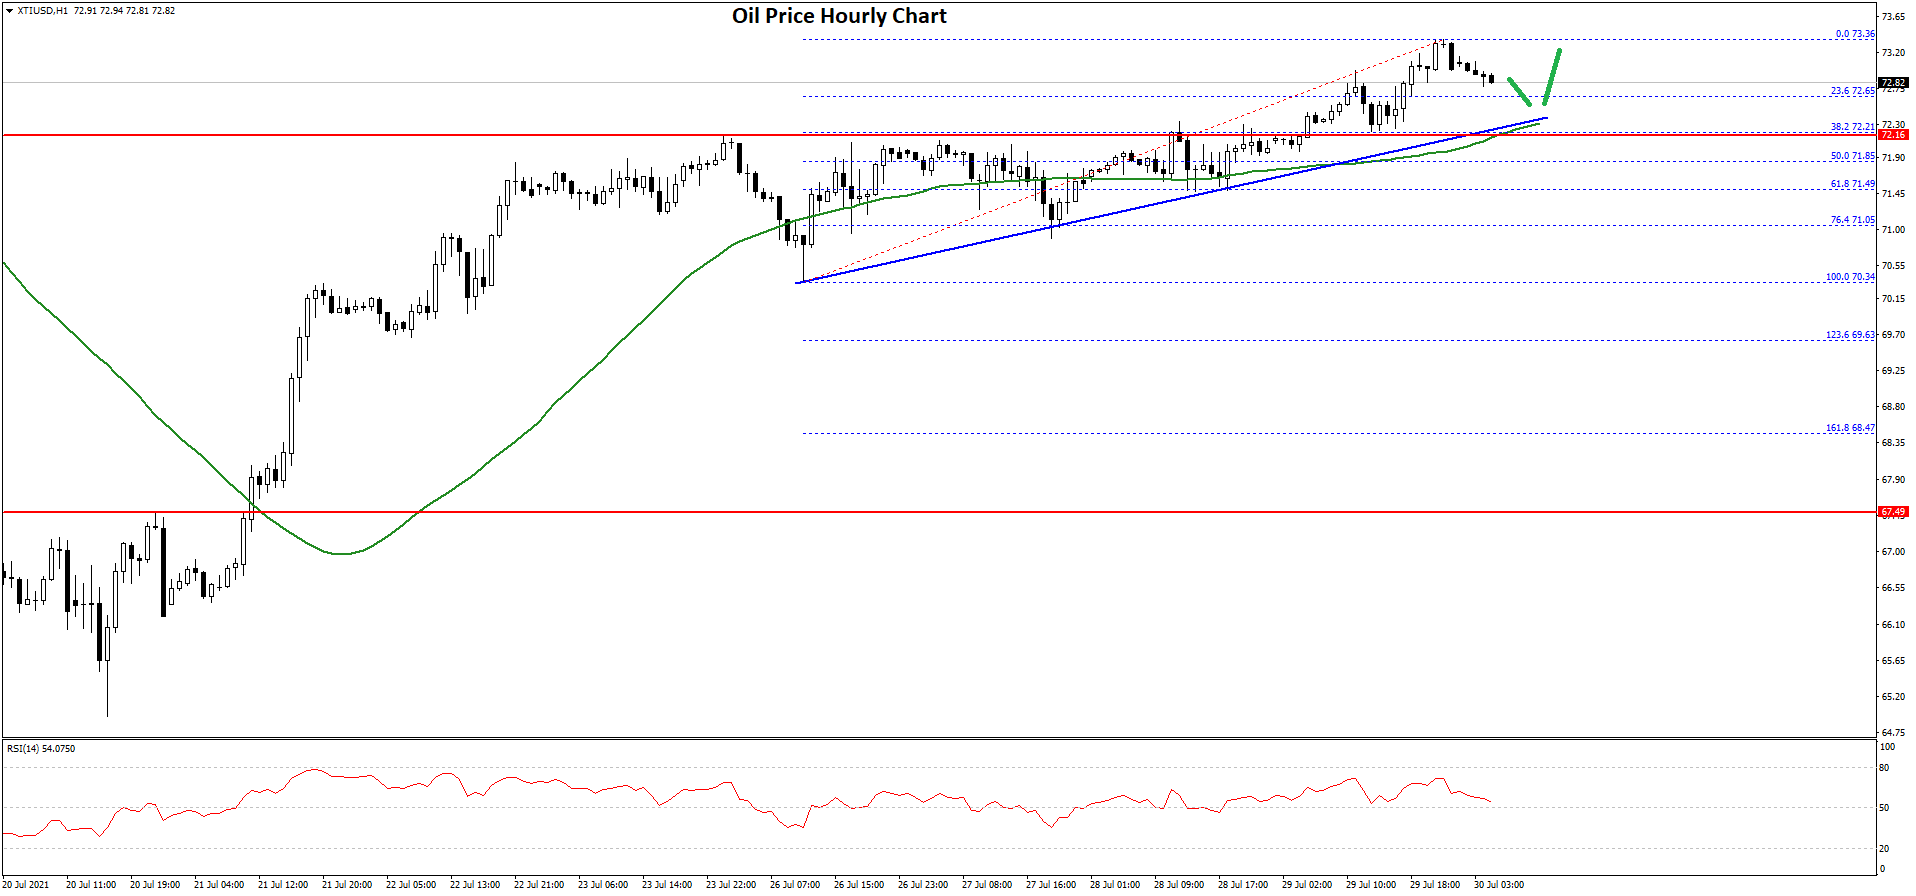
A high is formed near $73.36 and the price is now consolidating gains. An initial support on the downside is near the $72.65 level. It is near the 23.6% Fib retracement level of the upward move from the $70.34 swing low to $73.36 high.
The first major support is near the $72.30 level. There is also a major bullish trend line forming with support near $72.30 on the hourly chart of XTI/USD.
The main support is now forming near the $71.85 level. The 50% major bullish trend line forming with support near $72.30 on the hourly chart of XTI/USD is also near $71.85. Any more losses might call for a test of the $70.00 level.
On the upside, an initial resistance is near the $73.50 level. The next key resistance is near the $74.20 level. Any more gains could lift the price towards the $75.00 resistance zone in the near term.
This forecast represents FXOpen Markets Limited opinion only, it should not be construed as an offer, invitation or recommendation in respect to FXOpen Markets Limited products and services or as financial advice.
Trade over 50 forex markets 24 hours a day with FXOpen. Take advantage of low commissions, deep liquidity, and spreads from 0.0 pips (additional fees may apply). Open your FXOpen account now or learn more about trading forex with FXOpen.
This article represents the opinion of the Companies operating under the FXOpen brand only. It is not to be construed as an offer, solicitation, or recommendation with respect to products and services provided by the Companies operating under the FXOpen brand, nor is it to be considered financial advice.
Stay ahead of the market!
Subscribe now to our mailing list and receive the latest market news and insights delivered directly to your inbox.


Latest articles

Apple: Earnings Day Above the Activity Zone
On 30 April, after the market close, Apple Inc. will release its financial results for the second quarter of fiscal 2026. The consensus forecast, based on estimates from 31 analysts, points to revenue of around $109.7 billion, with expected

USD/JPY and USD/CHF Near Key Levels: The Dollar Supported by the Fed
The US dollar continues to trend upwards following the Federal Reserve meeting, drawing support from the regulator’s moderately hawkish stance and comments by Jerome Powell. Markets interpret the Fed’s rhetoric as a signal that restrictive policy is likely

EUR/USD and GBP/USD consolidate ahead of the Fed decision
European currencies are showing subdued dynamics, entering a consolidation phase following their previous advance. Earlier, EUR/USD and GBP/USD broke out of their ranges and strengthened; however, the subsequent correction has led both pairs to retest the previously breached